Skip to main content Skip to secondary navigation

This Hub is a cross-campus effort of the Precourt Institute for Energy. Take the Understand Energy course for credit.

Current Energy Landscape

Main content start

Energy Use by Resource

Embed Code

*Includes biofuels.
Note: This figure does not include difficult-to-measure traditional biomass (~7%). Percentages do not total 100 due to rounding of individual categories.
Source: Energy Institute. Statistical Review of World Energy. (2025)

Embed Code

*Includes biofuels

Percentages do not total 100 due to rounding of individual categories.
Source: ElA Monthly Energy Review. Energy Overview Table 1.3. (March 2025)

Electricity Generation by Resource

Embed Code

*Includes biofuels.
**Includes uncategorized generation, statistical differences and sources not specified elsewhere e.g. pumped hydro, non renewable waste and heat from chemical sources.
Source: Energy Institute. Statistical Review of World Energy. (2025)

Embed Code

*Includes wood and waste

Percentages do not add to 100 due to rounding of individual categories.
Source: ElA Monthly Energy Review. Electricity Table 7.2a. (March 2025)

Energy Use by Sector

Embed Code

Source: International Energy Agency. World: Efficiency & demand. 2025.

Embed Code

Source: Lawrence Livermore National Laboratory. Energy Flow Charts. 2025.

Note that the data for the world is total final energy consumption by sector, and the data for the U.S. is primary energy consumption by sector. Total final energy consumption is only the energy to meet demand and does not include the upstream losses. Primary energy consumption is the total energy supply to each sector, including losses in the energy system as well as energy to meet demand. Unfortunately, primary energy consumption by sector isn't tracked for the world.

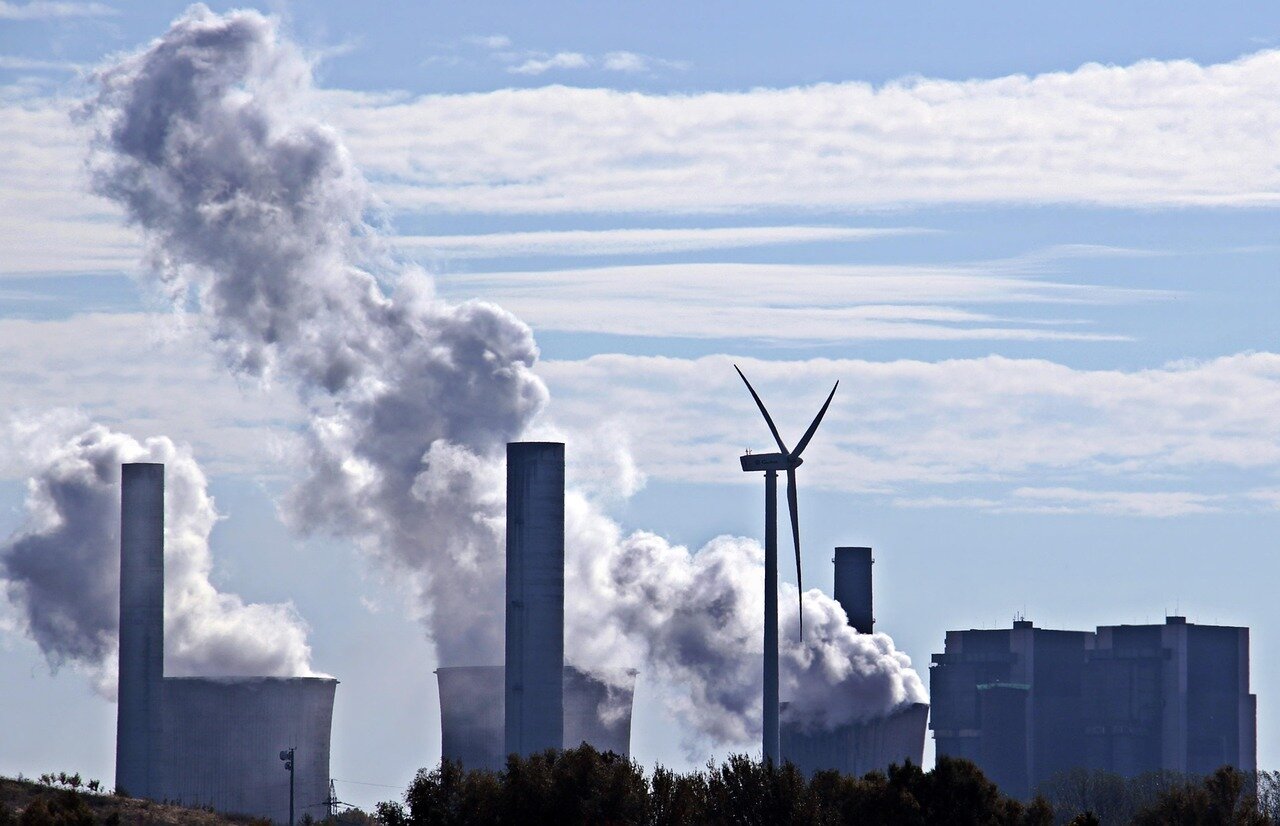
Energy and Climate Change

Embed Code

Source: Climate Watch. Historical GHG Emissions. 2026.

Image of the atmosphere bathtub showing that we are currently very close to 1.5°C and that we need to rebalance the natural carbon cycle by turning off human GHG emissions and removing gigatons of CO2 from the atmosphere.

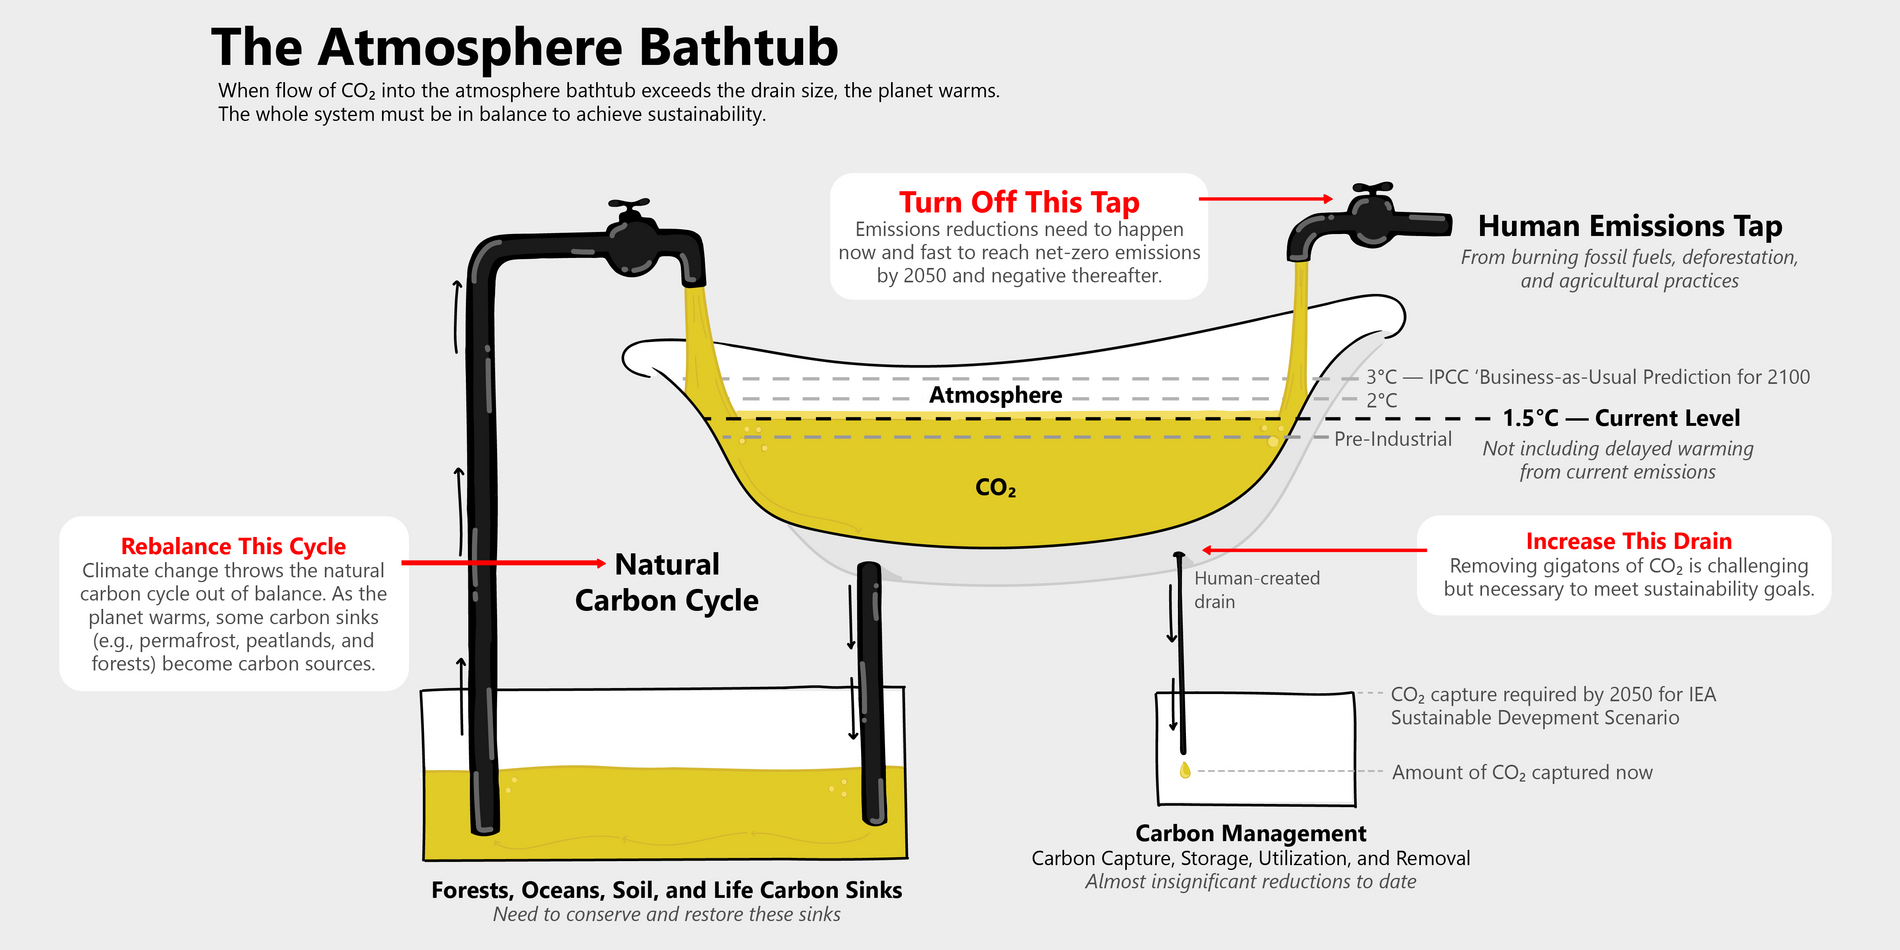
Sources: The Intergovernmental Panel on Climate Change (IPCC). Policymaker Summary of Working Group I (Scientific Assessment of Climate Change) Executive Summary; International Energy Agency (IEA). CCUS in Clean Energy Transitions. September 2020. 
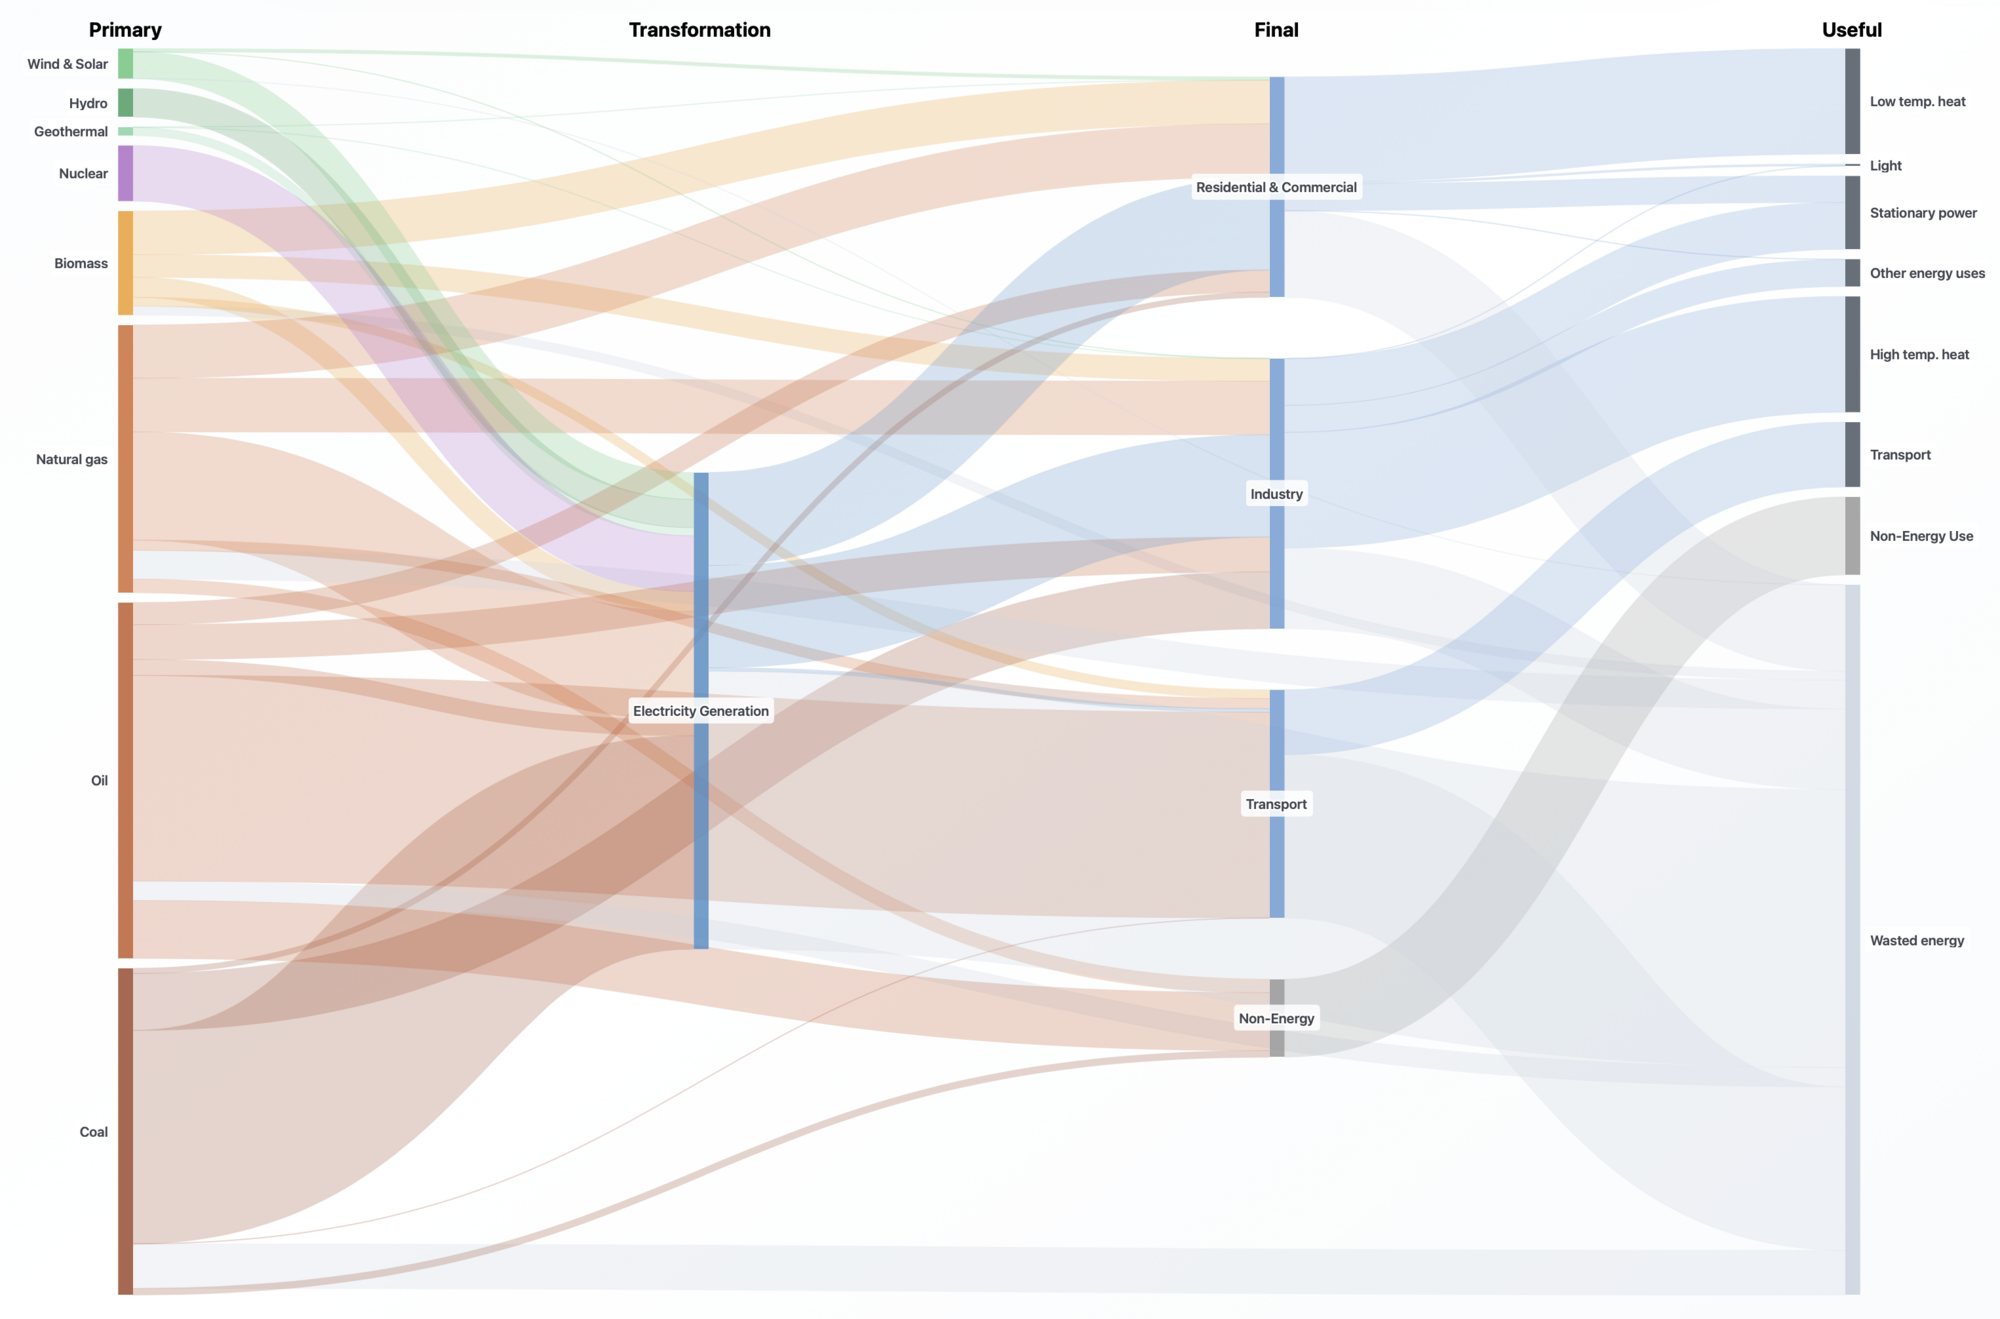
Energy Systems

An energy system converts primary energy resources (like fossil fuels or wind) into energy currencies (like electricity) to provide services humans want and need. 

Diagram of an energy system showing how energy resources relate to energy currencies, energy storage, and energy services

World Energy System Overview

The world energy system is only 42% efficient. 58% is lost (rejected energy).

Diagram showing the flow of energy from sources to consumption
Source: LLNL 2014. Data is based on IEA's Extended World Energy Balances (2013 Edition)
All quantities are rounded to 2 significant digits and annual flows of less than 0.05 PJ are not included. Totals may not equal sum of flows due to statistical differences. Imports and Exports represent gross global trade. Further detail on how all flows are calculated can be found at http://flowcharts.llnl.gov

View full size | Download tabular data World Energy Flow 2011 (XLSX, 11KB)

U.S. Energy System Overview

The US Energy System is only 32% efficient. Two-thirds is lost (rejected energy). See how it has changed over time in this visualization.

Sankey diagram details the sources of energy production, how it is used, and how much is wasted in the U.S.
Source: LLNL October, 2024; DOE/BIA SEDS (2024).
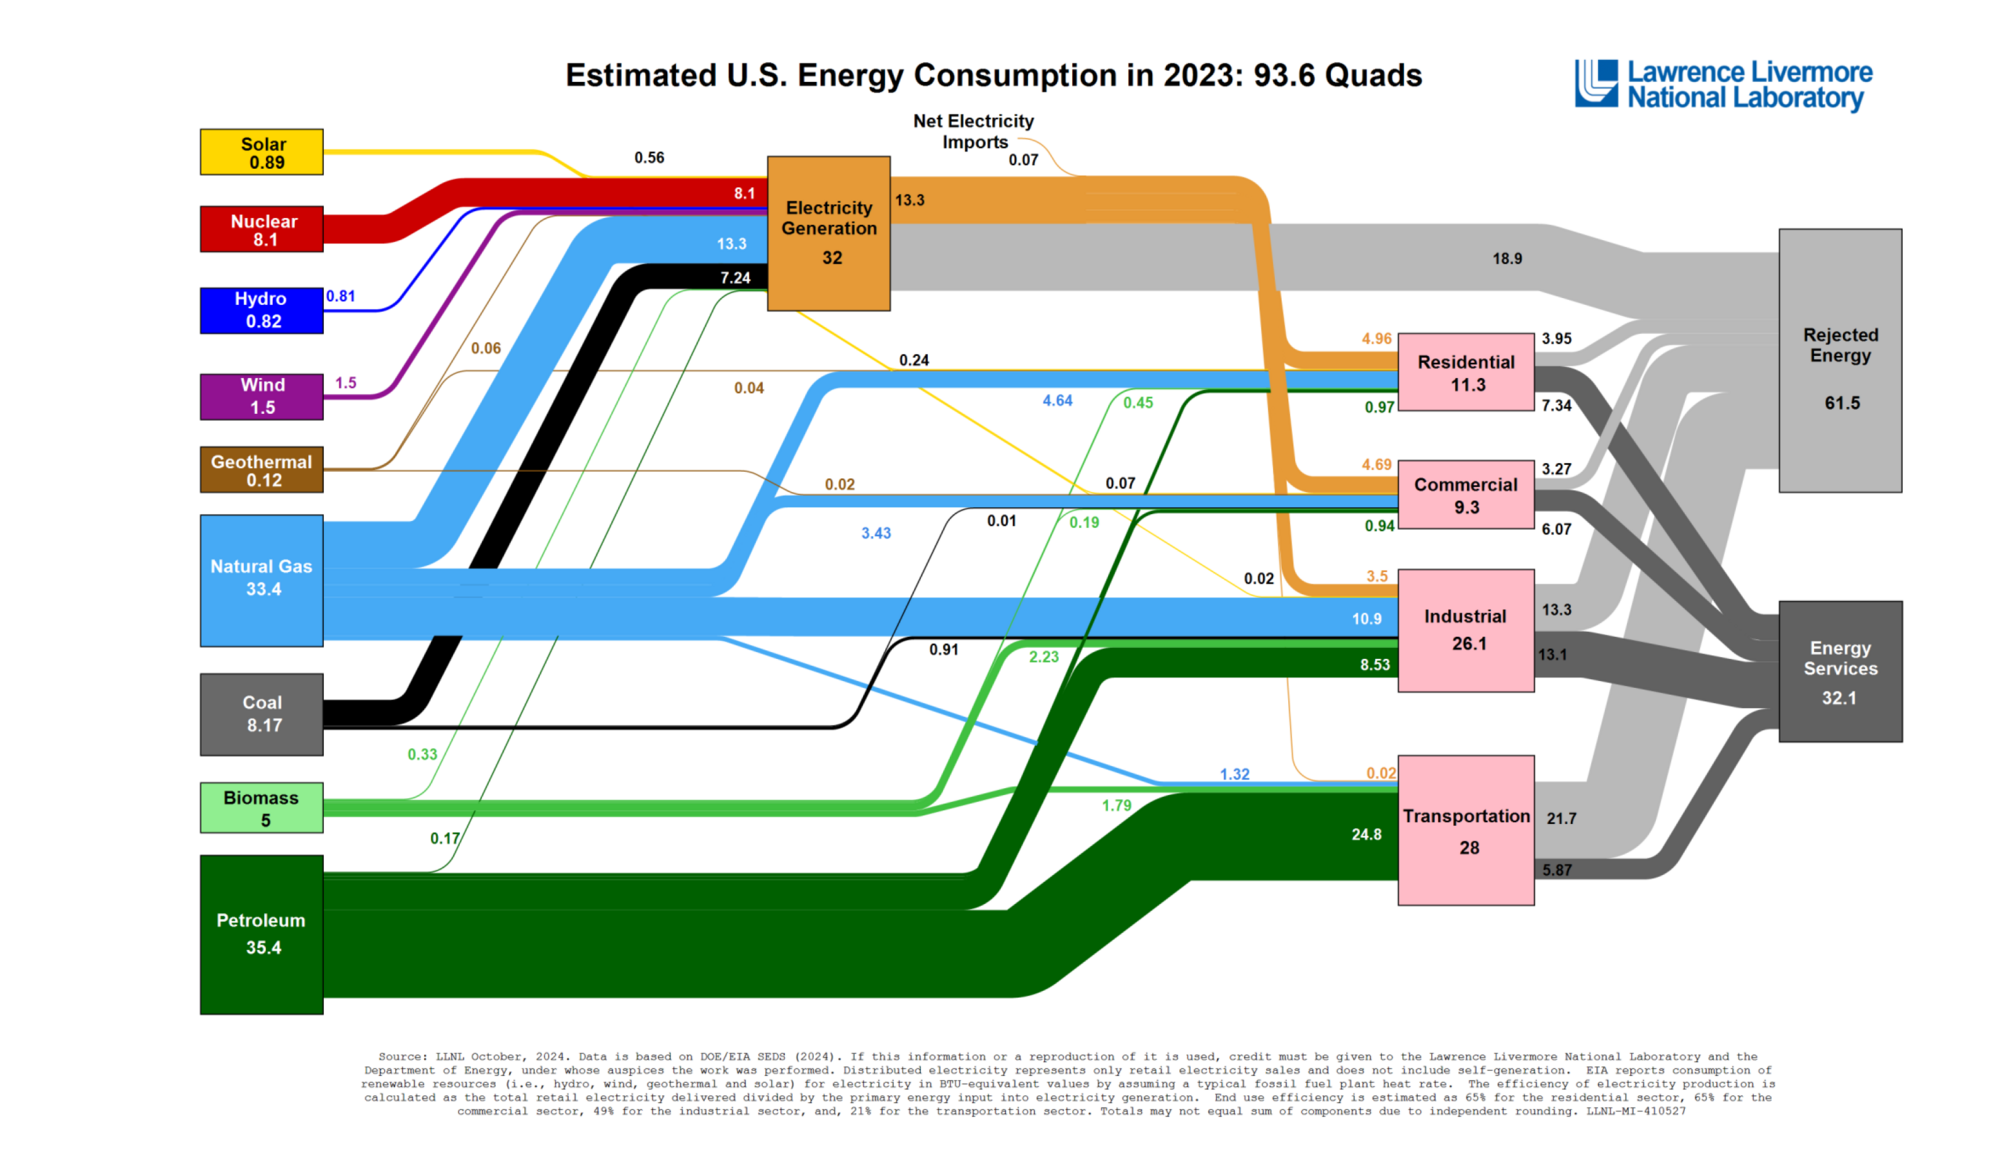
Distributed electricity represents only retail electricity sales and does not include self-generation. EIA reports consumption of renewable resources (i.e., hydro, wind, geothermal and solar) for electricity in BTU-equivalent values by assuming a typical fossil fuel plant heat rate. The efficiency of electricity production is calculated as the total retail electricity delivered divided by the primary energy input into electricity generation. End use efficiency is estimated as 65% for the residential sector, 65% for the commercial sector, 49% for the industrial sector, 21% for the transportation sector. Totals may not equal sum of components due to independent rounding.

View larger | Download tabular data Estimated US Energy Consumption 2023 (XLSX, 11KB)