Oil
Exploring Our Content
Check out our Energy Spotlights on crude oil and oil trade and transportation!
Fast Facts About
Oil
Principal Energy Use: Transportation
Form of Energy: Chemical
Oil (also referred to as petroleum) is the most-used energy resource in the world and provides more than 90% of global transportation energy. About two-thirds of global oil use is for transportation. Oil is a depletable, non-renewable mixture of liquid hydrocarbons burned to convert chemical energy into heat, and a leading contributor to air pollution and climate change. Because the majority of oil (54%) is produced by just five countries (the U.S., Saudi Arabia, Russia, Canada, and Iraq), securing access to this resource has significant geopolitical consequences.
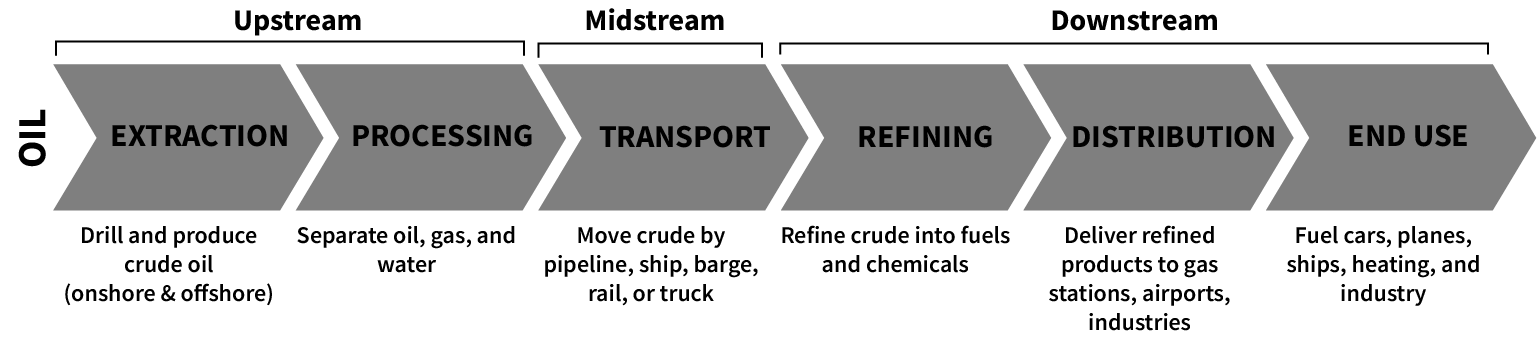
Oil is a mixture of hydrocarbons found mostly in liquid form in porous rocks beneath the Earth’s surface. The process to extract and transform oil into oil-based products follows these stages:
Because of its high energy density, both by weight and volume, oil is very convenient for transport (where you have to carry your fuel with you). This makes it difficult to replace oil with less energy dense low-carbon alternatives, such as hydrogen or batteries.
Learn more about the upstream stage on our Prospecting for Oil and Natural Gas, and Drilling, Completing, and Producing from Oil and Natural Gas Wells pages.
Learn more about the downstream stage on our Energy for Transportation and Gasoline, Diesel, Jet Fuel, etc. pages.
Oil-Fueled Transportation Energy Systems are Highly Inefficient
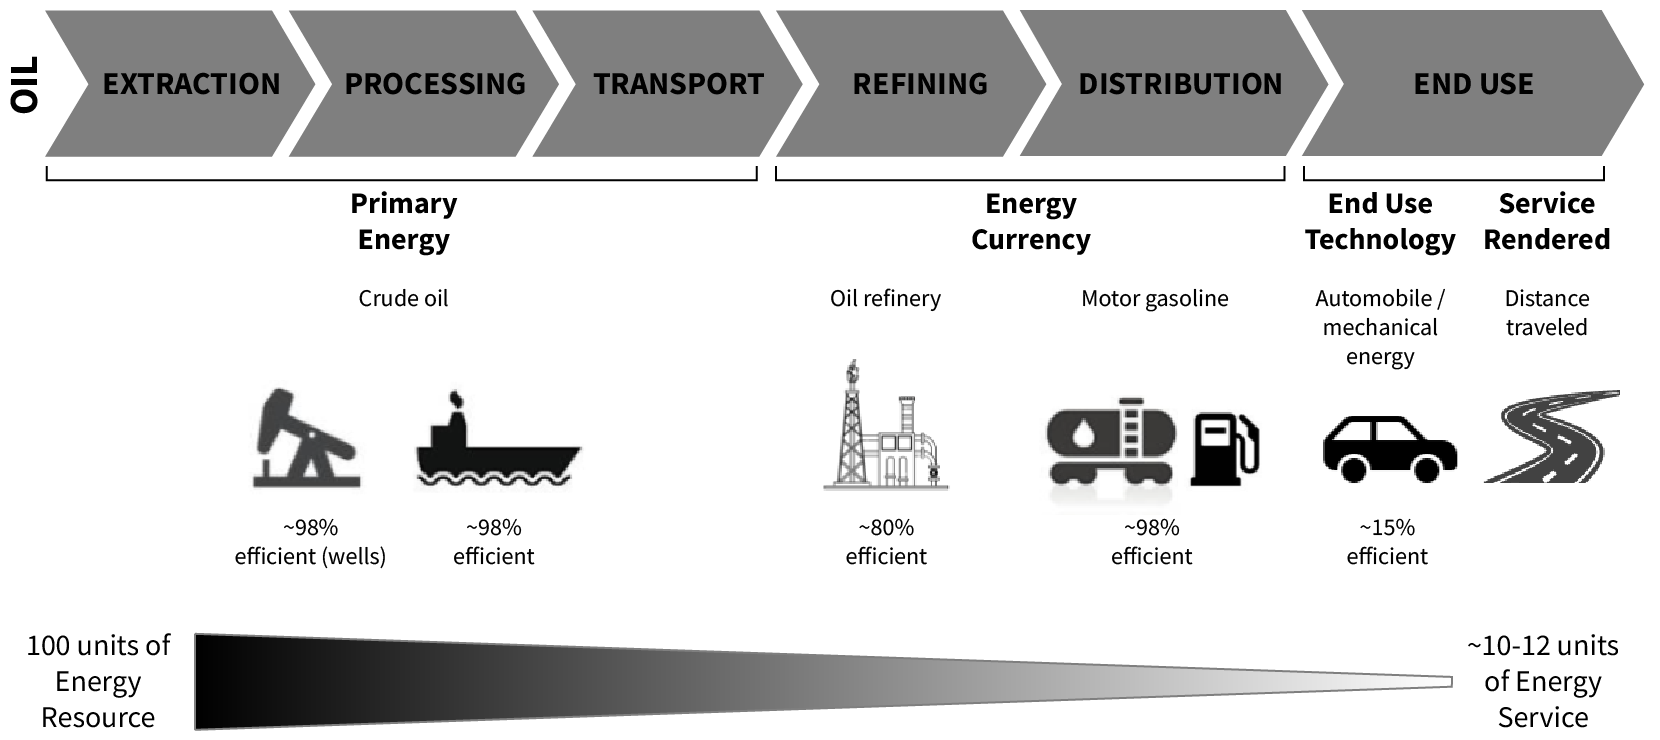
- Oil production and refining processes are relatively efficient. Only 25% of production is lost between the well and the fuel pump
- ~85% of the fuel put into an automobile never reaches the wheels. It is lost to engine and driveline inefficiencies, or used to power accessories
- Less than 1% of the car’s fuel moves the driver
Significance
Energy Mix
34% of world 🌎 (#1 resource)
38% of U.S. 🇺🇸 (#1 resource)
Electricity Generation
2% of world 🌎 (#7 resource)
< 1% of U.S. 🇺🇸 (#9 resource)
Transportation Energy
91% of world 🌎
89% of U.S. 🇺🇸
Change in Global Consumption
Increase:
⬆ 3%
(2019-2024)
36% of world 🌎
44% of U.S. 🇺🇸
energy GHG emissions are from oil
(includes methane leakage)
Energy use is responsible for ~75% of global GHG emissions.
(Visit our Natural Gas page for more information on methane leakage)
Oil Use for Transportation Is a Major Contributor to Outdoor Air Pollution
12% of world 🌎
21% of U.S. 🇺🇸
PM2.5 emissions come from transportation
PM2.5, particulate matter smaller than 2.5 microns, emissions pose the greatest risk to health. Other pollutants include carbon monoxide (CO), nitrous oxides ( NOx), and ozone (O3).
Adverse health effects from transportation (e.g., vehicle exhaust, brake and tire wear) include cancer, cardiovascular disease, respiratory diseases, diabetes mellitus, obesity, and reproductive, neurological, and immune system disorders.
In the U.S., vehicle standards (e.g., Tiers 1, 2, and Tier 3 for light-duty vehicles, diesel engine rules, and clean fuel programs since the 1970s) have significantly reduced transportation-related PM2.5 pollution and its health impacts.
Electric vehicles can further reduce air pollution and its health effects.
World
Largest Proved Reserves
Venezuela 18% 🇻🇪
of global proved reserves
Largest Producer
U.S. 21% 🇺🇸
of global production
Largest Consumer
U.S. 19% 🇺🇸
of global consumption
U.S.
Largest Proved Reserves
Texas 42%
of U.S. proved reserves
Largest Producer
Texas 43%
of U.S. production
Largest Consumer
Texas 21%
of U.S. consumption
Global Trade (Crude Oil)
Total Traded
72%
of global production
Largest Exporter
Saudi Arabia 15% 🇸🇦
of crude oil exports
Largest Importer
China 26% 🇨🇳
Europe 22%
of crude oil imports
Leading Refiners
U.S. 18% 🇺🇸
China 18% 🇨🇳
of petroleum product output (gasoline, jet fuel, diesel, etc.)
Drivers
- High energy density in volume and weight of oil; easy to store and transport
- Few alternatives for transport, especially long-haul trucking, shipping, and aviation
- Established infrastructure (e.g., fuel stations, refineries, manufacturing plants)
- Social and environmental externalities are not accounted for in price; subsidies further distort true costs
- Corporate lobby with political influence
- Innovation in extraction drives down costs and increases available resource (horizontal drilling, hydraulic fracking)
- Global and U.S. economies are very dependent on oil
- Desire to maintain economic and political power by exporting countries, including OPEC+
Barriers
- Many externalities: oil spills, air pollution, methane leakage, CO2 emissions, water use and contamination, land use
- Depletable, non-renewable resource
- National security: geopolitical conditions disrupt supply and price
- Inefficient; significant losses from well to moving people
- Public health: GHG emissions, SOx, NOx, etc. impacts near wells, refineries, and pipelines; past use of leaded gasoline
- Legacy infrastructure and pollution issues with abandoned wells and closed refineries
Climate Impact: High

- Carbon dioxide is released during combustion
- Methane leaks during extraction and production
Environmental Impact: High
- Ecosystem disturbance from exploratory wells, road construction, seismic techniques of exploration during prospecting
- Potential for significant land impacts, habitat destruction, and water contamination during extraction and transportation (pipelines)
- Potential thermal pollution of waterways from cooling in refineries
- Oil spills
- Air pollution from combustion (NOx, SO2, particulate matter, volatile organic compounds)
Our 10-Minute Take On
Oil
If you're short on time, start by watching this video of key highlights from our lecture on Oil.

Presented by: Diana Gragg, PhD; Core Lecturer, Civil and Environmental Engineering, Stanford University; Explore Energy Managing Director, Precourt Institute for Energy
Recorded: April 4, 2025
Duration: 13 minutes
If you liked this video, watch the other 10-Minute Takes here!
Curated Videos and Readings on
Oil
We assign videos and readings to our Stanford students as pre-work for each lecture to help contextualize the lecture content. We strongly encourage you to review the Essential videos and readings below before watching our lecture on Oil. Include selections from the Optional and Useful list based on your interests and available time.
Essential
- Oil Sands 101. Student Energy. May 17, 2015. (3 min)
Quick overview of Oil Sands / Tar Sands - Distillation Basics. Valero Refining 101 Series. October 2, 2020. (4 min)
Explanation of distillation, a key process in oil refining. - How an Oil Tanker Works and Is Designed. 3D Living Studio. May 5, 2023. (8 min)
See how oil tankers are designed, loaded, and offloaded. - Neighbors of the Fence. The Bitter Southerner. May 1, 2015. (18 pages)
In depth article about the challenges facing oil refineries and fenceline communities in Baton Rouge, LA.
Optional and Useful
- Crude Basics. Valero Refining 101 Series. October 2, 2020. (7 min)
How crude oil differs and where different grades are located worldwide. - Refinery Configurations. Valero Refining 101 Series. October 2, 2020. (6 min)Detailed explanation of oil refinery equipment and processes.
- What Drives Crude Oil Prices?. EIA. Updates periodically.
An analysis of 7 factors that influence oil markets, with chart data updated monthly and quarterly. - More Stringent Marine Sulfur Limits Mean Changes for U.S. Refiners and Ocean Vessels. EIA Today in Energy. February 4, 2019. (1 page)
Requiring lower sulfur fuels for ocean vessels to reduce air pollution. - Red Sea Attacks Increase Shipping Times and Freight Rates. EIA Today in Energy. February 1, 2024. (2 pages)
Details one of the maritime chokepoints for oil transportation. - The True Cost of Fossil Fuels. Scientific American - Mason Inman. April 1, 2013. (4 pages)
A bit old, but a good introduction into the idea of the energy return-on-investment for different energy resources.
Our Lecture on
Oil
This is our Stanford University Understand Energy course lecture on oil. We strongly encourage you to watch the full lecture to understand oil as an energy system and to be able to put this complex topic into context. For a complete learning experience, we also encourage you to watch / read the Essential videos and readings we assign to our students before watching the lecture.
Presented by: Diana Gragg, PhD; Core Lecturer, Civil and Environmental Engineering, Stanford University; Explore Energy Managing Director, Precourt Institute for Energy
Recorded on: October 6, 2024 Duration: 52 minutes
Test Your Knowledge

Oil Quiz
Printable PDF: Questions, Answer Key
Crude Oil Quiz
Printable PDF: Questions, Answer Key
Additional Resources About
Oil
Government and International Organizations
- International Energy Agency (IEA) Oil, Oil Market Report - May 2024
- International Maritime Organization (IMO) Oil Tanker Safety
- US Energy Information Administration (EIA) Petroleum & Other Liquids, Oil and Petroleum Products Explained
- US Energy Information Administration (EIA) Today in Energy Oil/Petroleum
- US Federal Energy Regulatory Commission Oil
History
- PBS on Alaska Pipeline
- Valdez, AK History: Trans-Alaska Pipeline
- The Prize: The Epic Quest for Oil, Money & Power - Daniel Yergin (1991) 9-part video, also as a book
- History of Oil - Robert Newman (2007) 8-part video
- Winning the Oil End Game – Innovation for Profits, Jobs, and Security - Amory Lovins, et al., Rocky Mountain Institute (2004)
Fast Facts Sources
- Oil-fueled Transportation Energy System (U.S.): U.S. Department of Energy (DOE). Where the Energy Goes: Gasoline Vehicles. 2017.
- Share of oil Used for Transport (World 2023): International Energy Agency (IEA). World: Oil: How is Oil Used Globally?: Final Consumption of Oil Products. 2025.
- Energy Mix (World 2024): Energy Institute. Statistical Review of World Energy. 2025.
- Energy Mix (U.S. 2024): U.S. Energy Information Agency (EIA). Total Energy: Energy Overview, Table 1.3. 2025.
- Electricity Mix (World 2024): Energy Institute. Statistical Review of World Energy. 2025.
- Electricity Mix (U.S. 2024): U.S. Energy Information Agency (EIA). Total Energy: Electricity, Table 7.2a. 2025.
- Transportation Energy (World 2022): International Energy Agency (IEA). Transport: Energy. 2023.
- Transportation Energy (U.S. 2024): U.S. Energy Information Administration (EIA). Energy Use for Transportation. 2025.
- Consumption Change (World 2019-2024): Energy Institute. Statistical Review of World Energy. 2025.
- GHG Emissions From Oil (World 2022): International Energy Agency (IEA). Greenhouse Gas Emissions from Energy Data Explorer. October 22, 2025; International Energy Agency (IEA). Emissions from Oil and Natural Gas Operations in Net Zero Transitions. May 2023; International Energy Agency (IEA). CO2 Emissions in 2022. March 2, 2023.
- GHG Emissions from Oil (U.S. 2023): International Energy Agency (IEA). Greenhouse Gas Emissions from Energy Data Explorer: Fugitive Emissions, Total GHG Emissions from Energy per Product. 2024.
- Air Pollution (World 2015): International Council on Clean Transportation (ICCT). A global snapshot of the air pollution-related health impacts of transportation sector emissions in 2010 and 2015. 2019.
- Proved Oil Reserves (World 2024): OPEC. Annual Statistical Bulletin. 2025; Government of Canada. What are the oil sands? 2025.
- Largest Producer (World 2024): Energy Institute. Statistical Review of World Energy. 2025.
- Largest Consumer (World 2024): Energy Institute. Statistical Review of World Energy. 2025.
- Largest Proved Reserves (U.S. 2022): U.S. Energy Information Administration (EIA). Texas State Energy Profile. 2025.
- Largest Producer (U.S. 2024): U.S. Energy Information Administration (EIA). Primary Energy Production Estimates in Physical Units, Ranked by State. 2025.
- Largest Consumer (U.S. 2023): U.S. Energy Information Administration (EIA). Texas State Energy Profile. 2025.
- Percent Traded (World 2024): Energy Institute. Statistical Review of World Energy. 2025.
- Largest Exporter (World 2024): Energy Institute. Statistical Review of World Energy. 2025.
- Largest Importer (World 2024): Energy Institute. Statistical Review of World Energy. 2025.
- Leading Refiners (World 2024): Energy Institute. Statistical Review of World Energy. 2025.
More details available on request.
Back to Fast Facts