Understand Crude Oil

Happy February! This edition of Stanford University’s Understand Energy Learning Hub Energy Spotlight is about crude oil. Future editions will cover drilling and production, transport and trade, and refining crude oil into products. If you like what you see, please share widely and encourage others to subscribe. You can also check out all of our past issues!
What you need to know
Significance: Oil, also known as petroleum, is the world's most-used energy resource and provides more than 90% of global transportation energy. Oil is a leading contributor to air pollution and climate change. In 2022, oil contributed more than a quarter of global greenhouse gas (GHG) emissions. Oil includes crude oil, condensates, natural gas liquids (NGLs), and petroleum products like gasoline, diesel, and jet fuel.
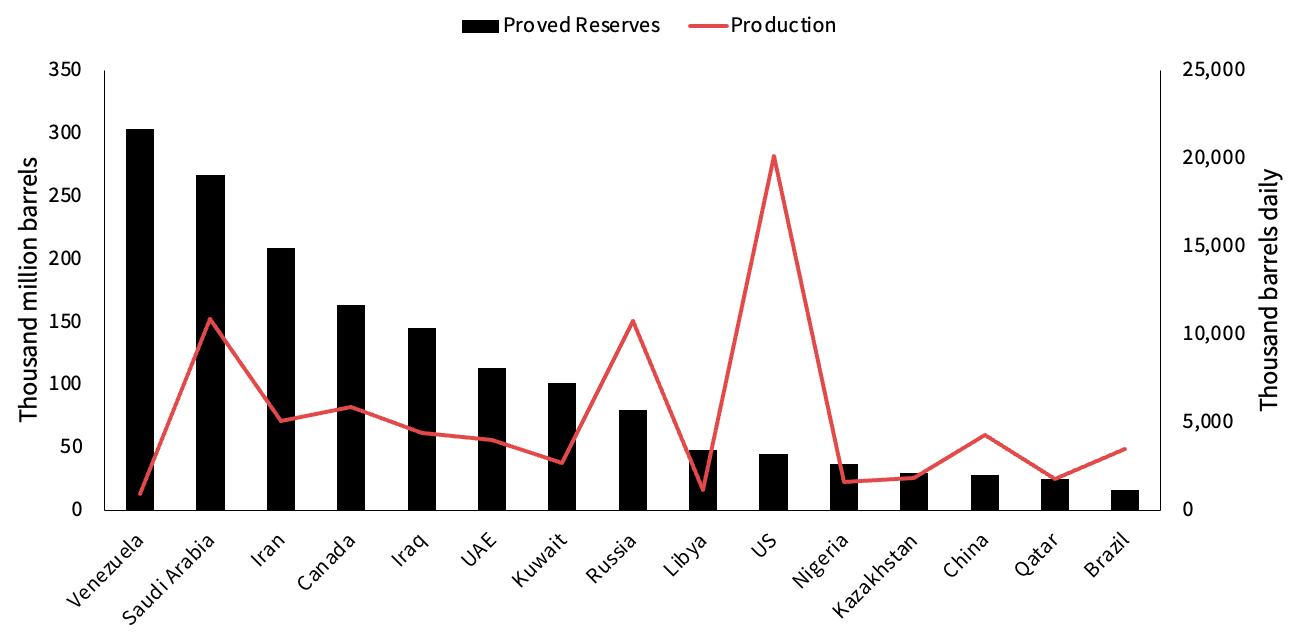
Because oil dominates transportation energy and is not distributed evenly around the world, securing access to it has significant geopolitical consequences. Venezuela and Saudi Arabia have the world’s largest proved reserves of oil. The United States is the largest producer of oil in the world (21% in 2024), but has just 3% of the world’s proved reserves. The U.S. is also the largest consumer of oil in the world (19% in 2024).
Oil proved reserves and production by country, 2024
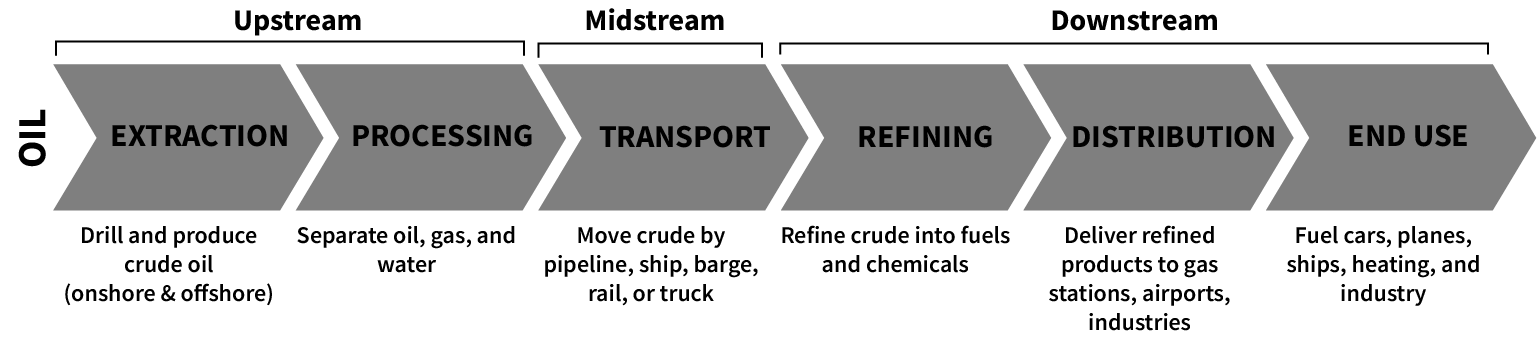
Oil energy systems have multiple steps. Oil is extracted from the subsurface (upstream), transported to refineries (midstream), and then made into petroleum products (downstream).
What is crude oil? Crude oil is the unrefined oil we get out of the ground. It is a depletable, non-renewable mixture of hydrocarbons found mostly in liquid form in porous rocks beneath the Earth’s surface. Crude oil also contains other substances like sulfur (1-3%), nitrogen (<1%), oxygen (<1%), and tiny amounts of metals and salts.
Crude oil forms from ancient marine and lacustrine (near lakes) microorganisms (e.g., algae, zooplankton, bacteria) that died and were buried, subjecting them to intense temperature and pressure over tens of millions to hundreds of millions of years. The location of crude oils today is largely determined by plate tectonics and specific geologic conditions.
Not all crude oil is the same. Crude oils are classified by three main characteristics:
- API gravity is a measure of a crude oil’s density (how it flows), which was developed as a standard by the American Petroleum Institute.
- Light crude oil has high API gravity (generally >35 degrees) so it flows easily (like vegetable oil).
- Intermediate crude oil has medium API gravity (~25-35 degrees) so it doesn’t flow as easily as light crude oil does.
- Heavy crude oil has low API gravity (generally <25 degrees) and flows more like molasses or peanut butter. Sometimes it is upgraded prior to refining.
- Sulfur content
- Sweet is low sulfur crude oil.
- Sour is high sulfur crude oil.
- Geographical location of origin
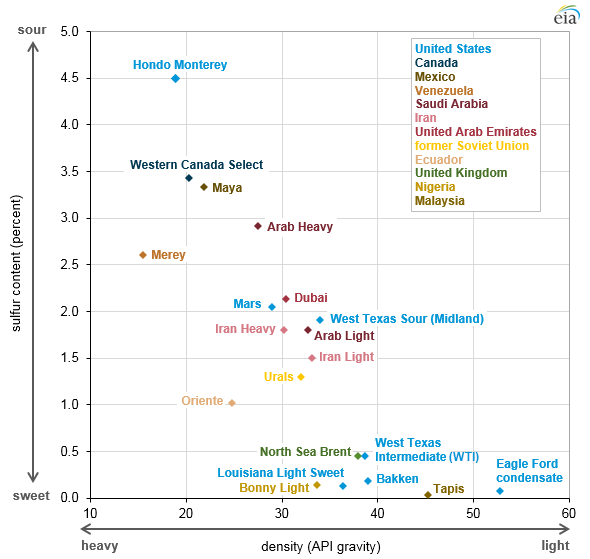
Light, sweet crude oils are usually priced higher than heavy, sour crude oils. Light crudes are easier to refine into high demand products like gasoline and jet fuel because their density is closer to the density of those fuels. Sweet crudes are easier to refine into low-sulfur fuels that meet air quality standards. Proximity of crude oil production to major markets and transportation systems also impacts the price of crude oils.
Density, sulfur content, and locations of selected crude oils
Crude oil prices: You’ve likely seen headlines saying “a barrel of oil costs $X.” But as we described above, different crude oils have different prices. The price of oil referenced in the media is the price of standardized benchmark crudes, typically Brent and WTI (West Texas Intermediate). In addition to quality and location, many other factors influence crude oil prices, including:
- Conflicts, wars, or sanctions in major producing regions (like the U.S., Middle East, and Russia) can create real or anticipated supply disruptions and cause crude oil prices to spike.
- Organization of the Petroleum Exporting Countries (OPEC) and other OPEC+ oil exporting countries can restrict production to keep prices high, or flood the market to drive out competitors that have higher operating costs. Even OPEC+ announcements for changes in production can cause immediate crude oil price swings.
- Global economic health can impact global oil demand. Strong economies mean higher demand for goods and transportation services, while recessions tend to reduce energy consumption.
- Extreme weather can disrupt supply and production. For example, hurricanes and cold snaps can force producers to take production offline, causing crude oil prices to increase.
The U.S. Strategic Petroleum Reserve (SPR)
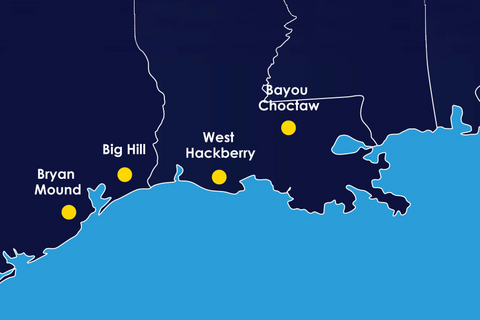
The SPR is the world’s largest supply of emergency crude oil. It’s a reserve of up to 713.5 million barrels of crude oil (about 35 days of U.S. supply) stored in 60 salt caverns along the Gulf Coast. In December 1975, President Ford established the SPR when he signed the Energy Policy and Conservation Act after the Organization of Arab Petroleum Exporting Countries imposed an oil embargo against the U.S. in 1973.
The goal of the SPR is to address severe oil supply disruptions and help minimize price shocks in the U.S. It also fulfills U.S. obligations under the International Energy Program, which requires member countries to hold in reserve the equivalent of 90 days of net imports of oil and petroleum products. Crude oil can be pumped from the reserve at a maximum of 4.4 million barrels per day, which is about 21% of U.S. daily oil consumption and 52% of U.S. daily oil imports.
Crude oil is stored in salt caverns along the Gulf Coast
The U.S. President has authorized emergency releases from the SPR four times (three were in coordination with other International Energy Agency (IEA) member countries):
- 2022 IEA coordinated release to address supply disruptions related to Russia’s invasion of Ukraine
- 2011 IEA coordinated release to address supply disruptions related to Libya’s civil war
- 2005 Hurricane Katrina drawdown when Hurricane Katrina took about 50% of U.S. crude oil production offline
- 1991 Operation Desert Storm emergency sale as part of an international effort coordinated by the IEA to minimize world oil market disruptions
As the U.S. has produced more of its crude oil domestically, it has become less vulnerable to international supply shocks. In 2010, the U.S. was importing about two-thirds of its crude oil supply. That’s down to about one-third today.
How much crude oil is there? We can use the McKelvey framework to classify crude oil quantities for a particular location based on the technological and economic feasibility of extraction. The framework can also be used for other resources like natural gas, gold, uranium, and copper.
Simplified McKelvey diagram
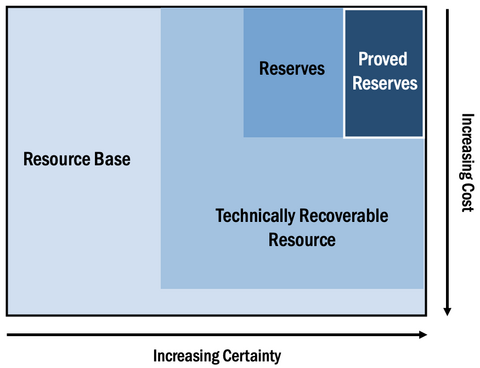
Resource base is the best estimate of every molecule of the resource in existence, regardless of the technological or economic feasibility of extraction.
Technically recoverable resources are the best estimate of the amount that can be feasibly produced using today’s technology.
Reserves are the economically recoverable resource that can be profitably recovered at today’s prices and with today’s technology.
Proved reserves are reserves established using geologic and engineering data gathered via seismic testing and exploratory drilling, and that can be profitably recovered at current prices using today's technology. In the U.S., proved reserves are counted as financial assets and regulated by the Securities and Exchange Commission (SEC).
When crude oil prices rise or technology improves, technically recoverable resources that were previously uneconomic can become reserves. When crude oil prices decrease or technology becomes more expensive, reserves can decrease. Like reserves, proved reserves can shrink or grow as prices and costs change.
Where are crude oil proved reserves? Proved reserves of crude oil are concentrated in a few regions around the world. In 2024, over 70% of the world’s proved crude oil reserves were in OPEC nations. The world's largest proved reserves are in Venezuela, Saudi Arabia, and Iran (18%, 15%, and 12% respectively in 2024). (Note that proved reserve estimates differ by data source.)
Most of Venezuela’s and Canada’s proved reserves are extra-heavy crudes, which cost more to produce and can become uneconomic when crude oil prices drop. Canada’s oil sands contain extremely heavy crude oil deposits (bitumen) that were largely unproven until crude oil prices went above $30-40 a barrel in the early 2000s. Production from oil sands deposits in Alberta became the largest contributor to Canadian production starting in 2009. Venezuela’s oil is also mostly extra-heavy crude and was not classified as proved reserves until the 2010s, when crude oil prices climbed above $50-60 per barrel. Despite having the world’s largest proved reserves, Venezuela accounts for just 1% of global crude oil production. With the recent U.S. involvement, Venezuelan oil production could nearly double over the next two years according to J.P.Morgan.
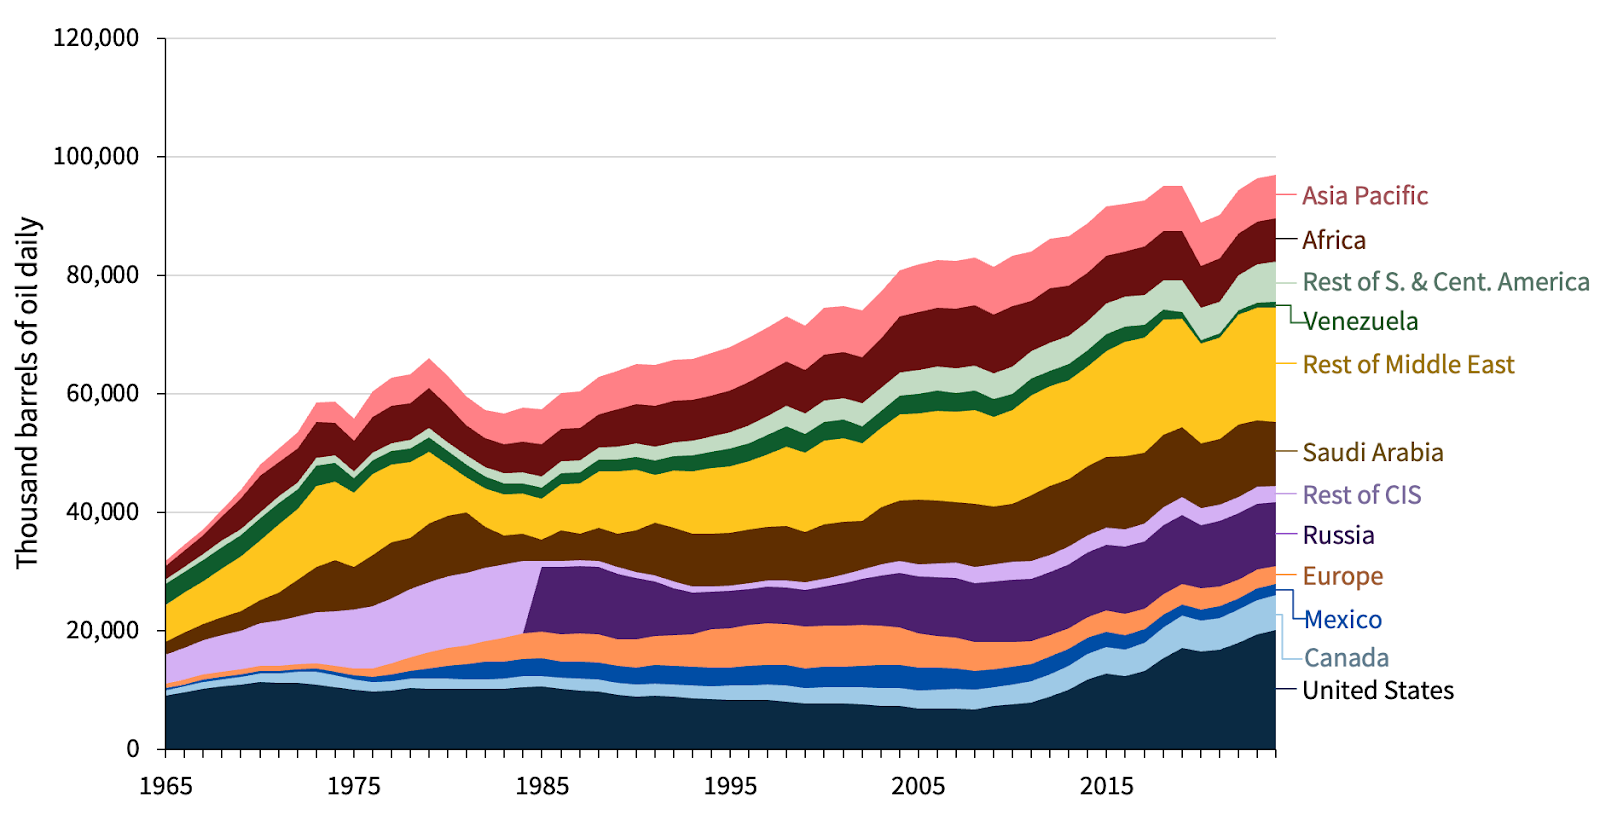
Where is crude oil produced? The U.S., Saudi Arabia, and Russia are the leading producers of oil at 21%, 11.2%, and 11.1% respectively in 2024. U.S. domestic oil production started ramping up with technological advancements in horizontal drilling and hydraulic fracturing around 2008.
World oil production by country/region,1965-2024
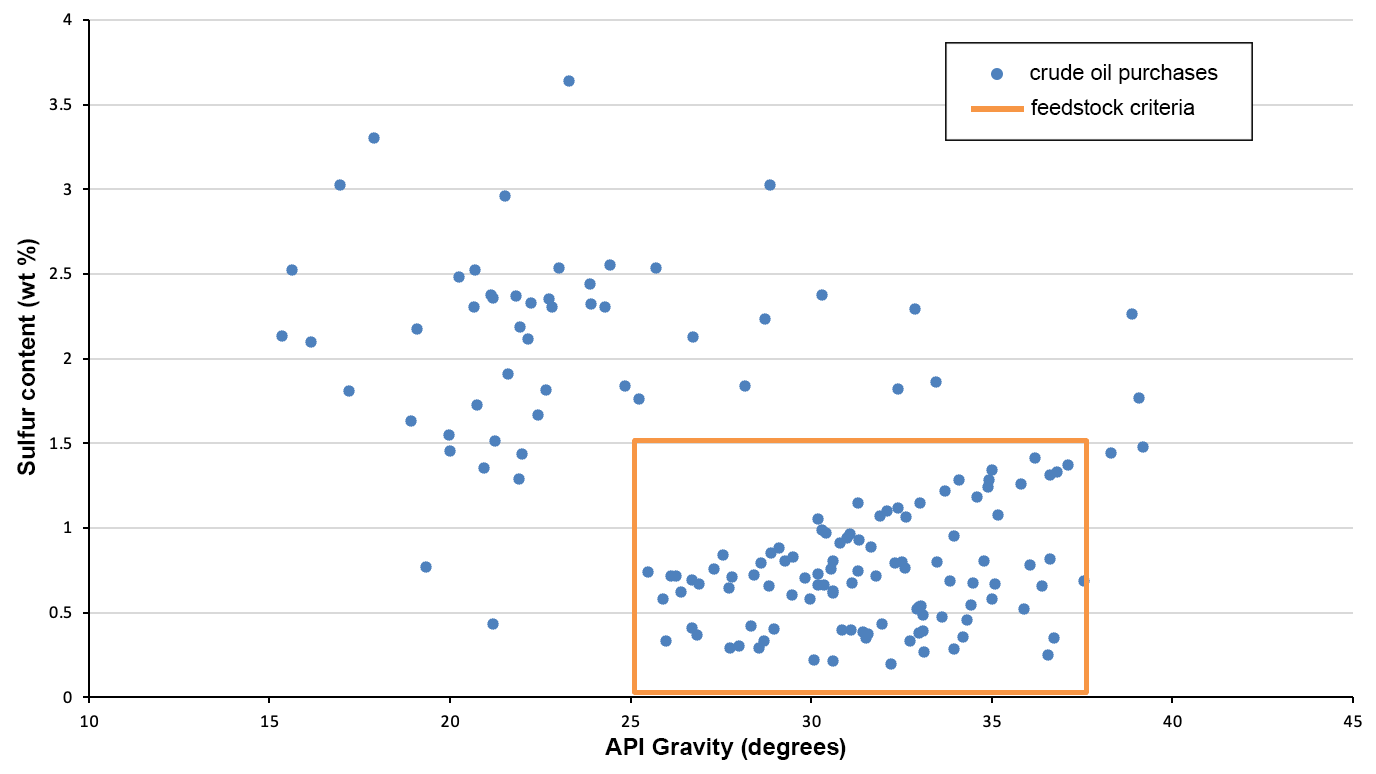
Oil refineries turn crude oil into fuels, such as gasoline, diesel, and jet fuel, and other products, like lubricants, waxes, and asphalt. Individual refineries are optimized to process specific crude oils (i.e., within a range of API and sulfur content), as shown in the chart below. Simple refineries can only process light, sweet crude oils, while more complex refineries can process heavy, sour crude oils. Refiners can combine different crude types to create blended feedstocks that meet their input requirements. For example, 70% of U.S. refining capacity runs most efficiently with heavier, more viscous crudes than what’s typically produced domestically. As a result, U.S. refineries often buy heavy oil (mostly from Canada) and blend it with domestic lighter crude oil.
Crude oil purchases for an example refinery
Environmental impacts of crude oil
GHG emissions: Although the majority of oil’s emissions come from its use for transportation (e.g., cars and trucks), significant GHG emissions can also occur during crude oil production. Examples include:
- Venting or flaring natural gas found with crude oil releases methane (a potent GHG) and CO₂.
- Heavy crude oils in particular are extremely energy and carbon intensive to produce. For instance, upgraded Canadian heavy crude oil has 3-4.5 times more GHG emissions per barrel than conventional crude oil from North America.
Air, water, and land impacts: Oil exploration and production can disrupt ecosystems and communities in myriad ways. For example, produced water (ancient water brought to the surface along with crude oil) often contains dissolved salts, heavy metals, and other compounds that can contaminate soil and groundwater if not properly managed. Also, natural gas flaring releases air pollutants such as nitrogen oxides (NOx) and volatile organic compounds (VOCs) which can degrade local air quality and negatively impact human health.
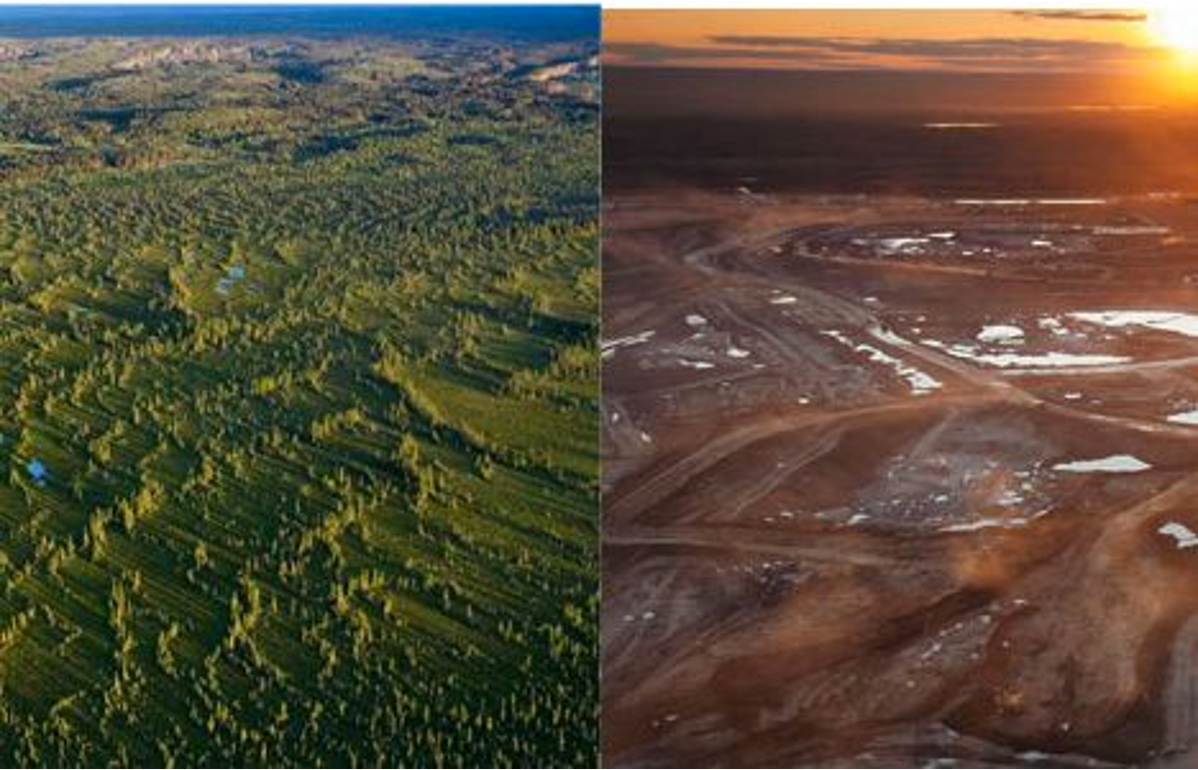
Open-pit mining, one of the methods used for crude oil extraction from oil sands in Canada, significantly impacts land and water. It requires removing surface vegetation and soil from areas spanning hundreds of square kilometers, as well as creating ponds to hold oil tailings (a toxic mixture of water, sand, clay, and residual bitumen). Tailings ponds in Alberta currently cover more than 220 square kilometers and contain over 1.4 trillion liters of fluid tailings (roughly enough to fill 560,000 Olympic-size swimming pools). These ponds pose a risk of contamination to watersheds and rivers, and remediation plans are still being discussed.
In the news
News: U.S. refiners are struggling to absorb the recent surge in Venezuelan crude oil following January’s $2 billion crude oil supply deal between Venezuela and the U.S. Many U.S. refiners are reluctant to purchase Venezuelan heavy crude oil because it costs more than Canadian heavy crude oil and has a complicated history.
Context: U.S. refineries are under pressure from the Trump administration to buy crude oil from Venezuela. Increased U.S. demand for Venezuelan crude oil would likely reduce U.S. demand for Canadian crude, significantly impacting Canada’s oil industry. Currently, the U.S. buys 80% of Canada’s crude oil output. In addition, the U.S.’s recent involvement with Venezuelan crude oil has had geopolitical impacts. For example, China has condemned the U.S.’s actions, and, according to U.S. envoy Sergio Gor, the U.S. is in “active negotiations” over the sale of Venezuelan oil to India to help India diversify its sources of crude oil (and stop importing Russian oil) in exchange for reduced U.S. tariffs on Indian goods.
Fun Fact
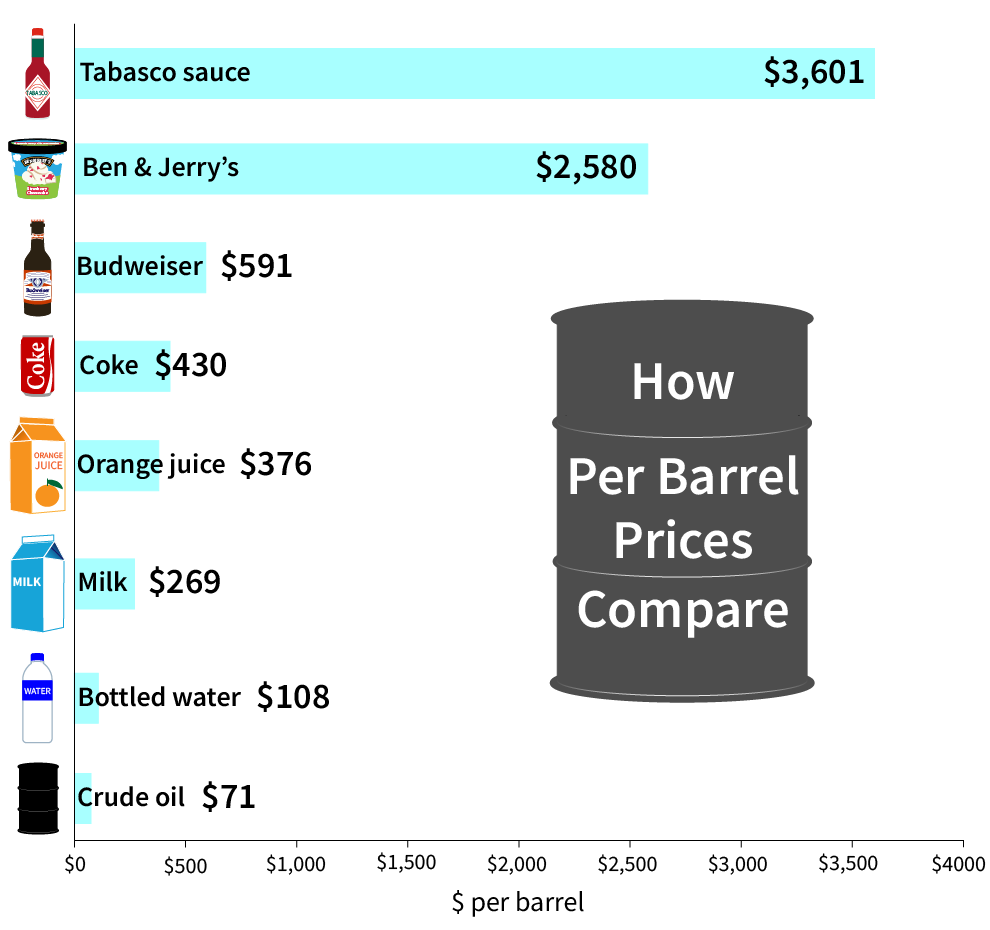
Crude oil is cheaper than bottled water!
It might surprise you to find out that crude oil is a relatively low-cost liquid, despite all the work it takes to extract, produce, and transport it to refineries. The low cost of crude oil has implications for secondary and tertiary oil recovery, where producers pump other fluids underground to recover more crude oil from the reservoirs. Any fluid that producers use needs to be cheaper than the crude oil in order to be economic. That’s why when producers decide to do secondary or tertiary recovery, they use things like wastewater, associated natural gas with no infrastructure for capturing and selling it, or CO₂ (mined or captured).
Want to test your knowledge of crude oil?
Take our quiz.
Understand Energy team contributors: Dr. Diana Gragg, Bria Schraeder, Sharon Poore, and Shirley Chang
The data in this issue are current as of February 2026. For the most current data, visit our Oil Fast Facts.


