Understand Energy in India

Happy New Year! This edition of Stanford University’s Understand Energy Learning Hub Energy Spotlight is our first country spotlight and covers energy in India. If you like what you see, please share widely and encourage others to subscribe. You can also check out all of our past issues!
What you need to know
Significance: India is the world’s most populous country, surpassing China in April 2023. It has the third largest gross domestic product based on purchasing power parity (GDP PPP) and is one of the fastest growing major economies, growing 6-7% year over year. India is also the third largest energy consumer (7%), behind China (27%) and the United States (14%). Coal dominates India’s energy system, representing almost half of the country’s total energy supply and 75% of electricity generation. Air pollution and greenhouse gas (GHG) emissions from the combustion of fossil fuels and biomass (e.g., wood, dung, ethanol) are significant challenges in India.
Top energy resource
Coal (46% of total energy supply)
Key metrics for India, including global rankings and associated data
| Metric | Global ranking | Associated data |
|---|---|---|
| Population | #1 | 1.46 billion people (38% increase 2000-2025) |
| GDP PPP (current prices) | #3 | $17.71 trillion (6-7% real GDP annual growth) |
| GDP PPP per capita (current prices) | #126 | $12,100 |
| Annual energy consumption | #3 | 46 EJ (7% of world) (166% increase 2000-2023) |
| Net energy importer | #3 | 37% of total energy supply (370% increase 2000-2023) |
| Renewables share of electricity | #89 | 22% of electricity generation (62% increase 2000-2022) |
| Annual electricity consumption | #3 | 1987 TWh (254% increase 2000-2023) |
| Annual electricity consumption per capita | #106 | 1.182 MWh/person (207% increase 2000-2023) |
| Annual GHG emissions | #3 | 3.81 GtCO₂e (7.5% of world) (135% increase 2000-2022) |
| Annual per capita GHG emissions | #124 | 2.67 tCO₂e/person (75% increase 2000-2022) |
Total energy Supply: represents all the energy resources used for electricity generation, transportation, industry, agriculture, cooking, heating (water and space), and other energy services, as well as non-energy uses of fossil fuels (e.g., feedstocks). Fossil fuels constitute over 75% of India’s total energy supply. Coal accounts for 46% and is used primarily for industry and electricity generation. India is the second largest coal-consuming country in the world behind China, and the third largest coal producer behind China and Indonesia. Coal is the dirtiest and most carbon-intensive fossil fuel, worsening India’s air quality and contributing to climate change.
Oil accounts for 25% of India’s energy supply and is used mainly for transportation. India is the third largest oil consumer behind China and the U.S., but only produces about 11% of its oil supply. India’s oil demand grew by 142% from 2000-2023.
Electricity generation has experienced significant growth in India since the 2000s. Coal provides almost 75% of India’s electricity generation. Coal provides almost 75% of India’s electricity and has experienced significant growth since the 2000s. Coal-fired power plants are extremely inefficient, losing two-thirds of the energy inputs as waste heat.
Renewables provided 22% of India’s electricity generation in 2022, an increase of 62% since 2000. Hydropower accounted for 7%, solar PV for 6%, and wind for 5%, with solar PV being the fastest growing. For comparison, renewables provided 30% of electricity generation in China and 21% of electricity generation in the U.S. in 2022. Despite this growth in renewables, India has one of the ten least decarbonized electric power systems in the world.
Visit India Climate & Energy Dashboard to explore further.
India’s energy history
India is estimated to have had the largest economy in the world between the first and 17th centuries AD, representing over 25% of the world’s GDP until the 16th century. During that period, India relied exclusively on traditional biomass sources (e.g., firewood, crop residues, and animal dung) for cooking and heating.
The British colonial period introduced coal mining to India in the 1770s. Coal demand surged with the rise of railways, and by 1899, Calcutta saw the country's first coal-fired power plant. Following India’s independence from British rule in 1947, the Indian government started investing heavily in hydroelectric projects. Hydropower provided around 40% of total electricity generation capacity into the 1980s.
The post-independence government also began exploring for domestic oil and natural gas, establishing India’s nationalized oil and natural gas company, ONGC, in 1956. This led to a landmark moment in 1974 with the discovery of Mumbai (formerly Bombay) High, an offshore oil field that raised hopes for an “energy independent” India. However, India’s demand for oil and natural gas increasingly eclipses its supply capacity, requiring India to import both resources to meet demand.
In the 1960s, the Indian government invested in India’s indigenous nuclear program, with its first nuclear power plant becoming operational in 1969. India’s self-sufficiency in nuclear energy stems from its inability to import nuclear technology and fuel, because it was excluded from the 1970 Nuclear Non-Proliferation Treaty due to its nuclear weapons program. Today, India continues to expand its nuclear fleet with 24 operational nuclear reactors across seven sites and 7 reactors under construction. India is also developing technology to utilize its abundant resources of thorium as a nuclear fuel.
Read more about India’s energy history!
Fossil fuel trade: Countries relying on fossil fuel imports face affordability, access, and energy security challenges. India is a net importer of fossil fuels. It’s the second largest importer of coal (15% of global coal trade) behind China, even though net imports only account for less than a quarter of India’s coal consumption.
India is also the third largest importer of oil behind China and the U.S. After Russia’s invasion of Ukraine and resulting oil sanctions put in place primarily by the U.S., EU, and U.K., Russia went from supplying almost no oil to India to being India’s top oil supplier because India was able to get Russian oil at a discount. Russia remains India’s top oil supplier today.
Natural gas imports have grown dramatically in India (9,772% increase from 2003-2023), with net natural gas imports providing almost 50% of India’s total natural gas supply today. Natural gas is typically imported by pipeline over land or as liquified natural gas (LNG) over water. India is the fourth largest importer of LNG after China, Japan, and South Korea.
Energy import stats for India, 2023
| Energy resource | Production | Consumption | Net import % |
|---|---|---|---|
Coal | 16.14 EJ | 21.34 EJ | 24% |
Oil | 1.41 EJ | 11.35 EJ | 88% |
Natural gas | 1.25 EJ | 2.44 EJ | 44% |
We’ve covered energy supply and energy trade. Now let’s look at the demand side, which are the energy services people want and need like cooking, heating, cooling, lighting, charging their electronics, and more.
Energy efficiency is a powerful and limitless tool for reducing energy demand, air pollution, and GHG emissions while maintaining and improving quality of life. Energy efficiency means providing the same or better energy service using less energy (e.g., improving building insulation to reduce energy demand for heating and cooling). Identifying how and where energy is used is helpful for finding potential energy efficiency opportunities. In India, industry is the biggest energy-using sector, followed by residential and transport.
Energy intensity, the total energy supply per unit of economic output, is a proxy for measuring a country’s overall energy efficiency (lower is better). It’s not a perfect measure because it reflects both energy efficiency and the structure of the economy (e.g., an economy based on heavy industry would have very different energy needs than a services economy per unit of economic output).
India’s energy intensity is improving. It decreased by 36% between 2000 and 2023 and ranks 68th in the world. For comparison, China ranks 30th and the U.S. ranks 64th. According to the IEA, India’s increases in energy efficiency enabled the avoidance of an additional 15% of energy demand and 300 MtCO₂ emissions over the period 2000-2018. For example, India has been making strides in electrifying transportation. Electric trains, buses, and personal vehicles are more efficient than their fossil fuel counterparts. Indian Railways is 99.2% electrified, more than the U.S. (<1%) and the global average (75%). The share of electric vehicles sold in India has been growing and is now at almost 8%, about half the global average. India’s goal is 30% for the share of electric vehicles sold in 2030.
Modern energy access: Access to sustainable, affordable, and reliable modern energy services is fundamental for economic growth, human development, and quality of life. Modern energy access includes:
- Electricity: Access advances education, health, productivity, security, comfort, and entertainment. It also facilitates higher-value economic opportunities.
- Clean cooking fuels: Access reduces mortality and improves quality of life, especially for women and children, by dramatically reducing health impacts from indoor air pollution, decreasing safety risks associated with fuelwood collection, and freeing time for education and income-generating activities.
Electricity access has been growing in India. Since the 2000s, electricity access has increased from 60% to 99.5% of the population. However, grid reliability has been a challenge due to supply shortages and aging transmission and distribution infrastructure. According to a 2020 survey, half of rural households experience daily power cuts between 6pm and midnight.
Some industrial, commercial, and residential consumers use diesel generators to provide backup power. Diesel generators emit high nitrogen oxides (NOx) and particulate matter (PM2.5) emissions, negatively impacting air quality and human health. India’s government has taken steps to reduce the use of diesel generators, but they still remain a significant source of air pollution in urban areas.
Despite increasing access, India’s per capita use of electricity remains relatively low, about 20% of Europe’s and less than 10% of the U.S.’s. However, the country’s overall electricity demand has been increasing due to population growth, rising demand from industry, more commercial and residential buildings, and a greater number of people owning air conditioners and appliances. Demand for air conditioning is expected to keep growing due to more frequent and extreme heat waves from climate change.
Clean cooking fuels and technologies are those that attain the air pollution levels recommended by the World Health Organization (WHO) with respect to PM2.5 and carbon monoxide (CO). Clean cooking fuels generally include liquified petroleum gas (LPG), natural gas, biogas, and electricity, while dirty cooking fuels include kerosene, solid biomass (e.g., wood, peat, animal waste, crop residue), charcoal, and coal.
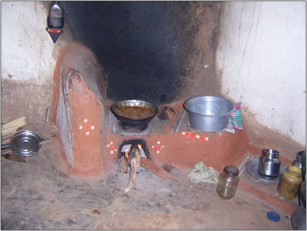
In India, household air pollution is a significant contributor to the total disease burden, accounting for nearly 600,000 deaths in 2019. Burning dirty fuels to prepare food on cook stoves (e.g., chulha) in households with poor ventilation exposes families, particularly women and children, to the harmful impacts of smoke and household air pollution. LPG, natural gas, and biogas also have household air pollution impacts, but their emissions are much lower than those for dirty cooking fuels. Cooking with electricity removes the source of household air pollution and is the cleanest cooking method.
Wood-fired cookstove in India
India has made significant progress in increasing the proportion of the population primarily using clean fuels and technologies for cooking. In 1990, only 11% of India’s population primarily used clean cooking fuels. By 2022, that share had increased to 74.5%, mainly through growth in LPG. However, LPG and natural gas have affordability challenges. Both are heavily import-dependent and subject to global price volatility despite government subsidies, making them at times unaffordable for some portions of the population.
Environmental and health impacts
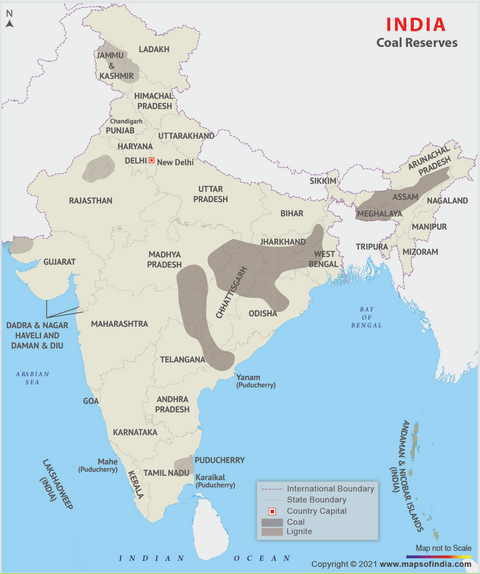
Coal mining impacts: More than 90% of coal mining in India is surface (aka opencast) mining, resulting in significant land degradation and displacement of people. An estimated 1.1 million acres of land are used for coal mining and thermal power production in India, most of it concentrated in the eastern coal belt of the country. Watch this video about the impacts of coal mining in India.
Coal reserves in India
Coal ash impacts: Coal ash is waste left behind after coal is burned. It contains toxic chemicals (e.g., arsenic, barium, cadmium, nickel, lead, and selenium) that are known to cause cancer, cardiovascular disease, and neurological damage, as well as contribute to premature mortality. India’s coal has significantly higher ash content (25-45%) than imported coal (10-20%), exacerbating the environmental challenges of coal and creating massive waste disposal issues. Although the government is trying to increase the utilization of coal ash (instead of disposal), over 1.6 billion tonnes of legacy coal ash remains, much of which has not been properly managed. For example, 76 major coal ash pond accidents between 2010 and June 2020 caused deaths, loss of property, and extensive pollution of water, air, and soil.
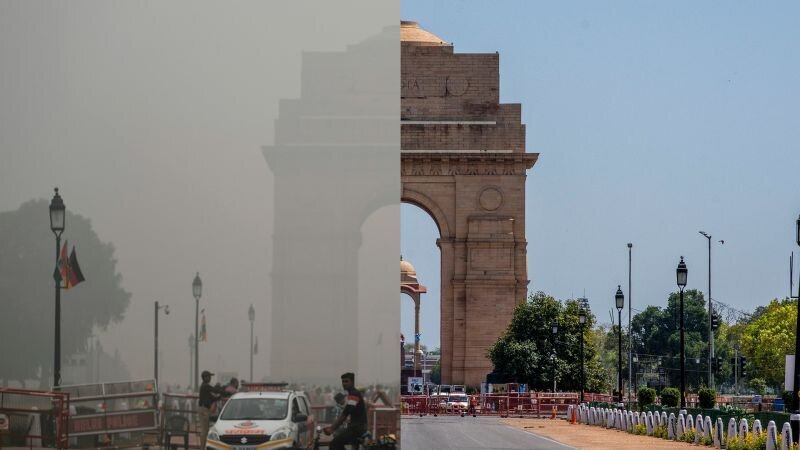
Air pollution (both indoor and outdoor) is the largest external threat to life expectancy in India and accounts for more than 2 million premature deaths per year. Coal-fired power plants, industry, vehicles, the burning of crop residue, and the use of dirty fuels for cooking and heating are significant sources of air pollution in the country. Twenty-one of the world’s 30 cities with the worst air pollution are in India. For example, New Delhi, India’s capital city, has concentrations of PM2.5 nearly 10 times higher than WHO guidelines. Some Indian companies, such as Shoppers Stop Ltd., cite elevated levels of air pollution as a cause for reduced consumer discretionary spending and poor financial results. Emissions from coal-fired electricity generation in India are also linked to crop damage, with yield losses >10% in many regions.
COVID-19 shelter in place leads to temporary reduction in air pollution
Climate Change: Despite a large and growing population, India has contributed less than 4% of cumulative GHG emissions from 1750 to 2024. India’s annual GHG emissions per capita are also quite low (#147 in the world). However, annual GHG emissions for the country as a whole are growing and accounted for ~8% of global GHG emissions in 2024, making it the third largest annual emitter today. Its carbon intensity, the ratio of GHG emissions to energy consumption, ranks among the ten worst (highest) in the world. Coal is the leading source of GHG emissions in India, contributing almost 70%.
India is the seventh most vulnerable country to climate change, with more than 80% of its urban population residing in hazard-prone areas. Ninety-one percent of Indians say they have personally experienced the effects of global warming. Extreme heat, unpredictable flooding, and severe storms are increasing. In 2024, India experienced extreme weather events on 322 days (almost 90% of the year). 2025 saw India’s hottest February on record. These extreme events have significant impacts, including crop loss, destruction of property, population displacement, and fatalities.
India’s current climate commitment is to achieve net-zero by 2070.
Current and future trends
The IEA’s 2025 World Energy Outlook forecasts India as the largest source of energy demand growth in the world through 2035. IEA expects India to be the largest contributor to growth in oil demand for this period, the second-largest for electricity generation and coal demand growth, and third-largest for natural gas demand growth.
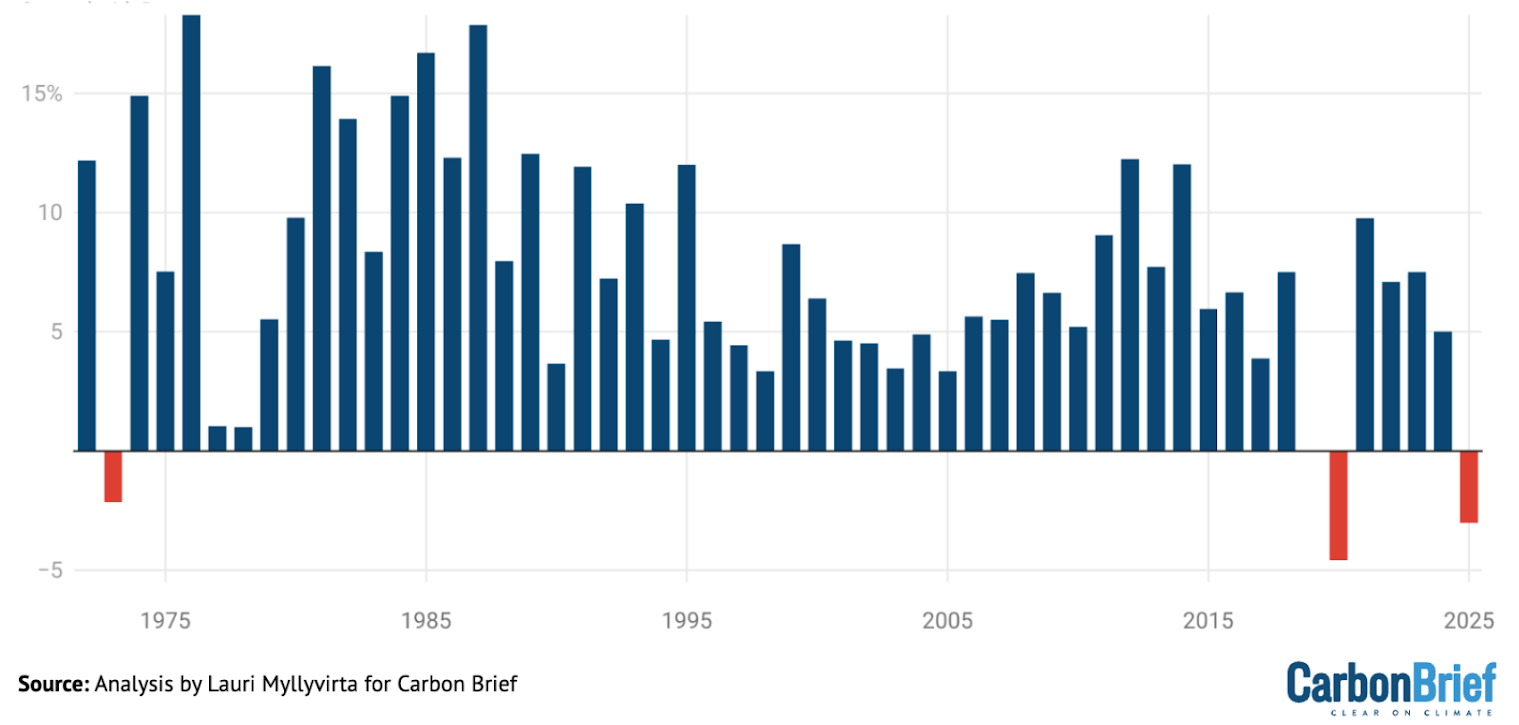
Despite these predictions, electricity generation from coal in India dropped by 3% in 2025. This decline was due to record clean-energy growth combined with slower demand growth, resulting from mild weather and a longer-term slowdown. India is rapidly scaling up renewables and has the fourth largest renewable energy installed capacity globally (254 GW), with a target to achieve 500 GW of non-fossil (renewables plus nuclear) energy capacity by 2030. According to a new Ember report, India is electrifying faster and using fewer fossil fuels per capita than China did when it was at similar levels of economic development. However, non-fossil energy growth would need to accelerate in order for coal use to peak in India and decline over the long term.
Growth in coal-fired electricity generation by year (%) in India, 1972-2025
Energy policy plays an important role in a country’s energy systems, impacting affordability, reliability, access, energy security, air pollution, and GHG emissions. Examples of India’s energy policies include renewable energy capacity targets, energy storage capacity mandates, time-of-use pricing for commercial and industrial electricity users, subsidies for electric vehicles, and an energy efficiency rating for high power appliances.
In the news
News: The EU’s world-first carbon tariff, which went into effect in January 2026, may force India’s steelmaking industry to decarbonize. The “carbon border adjustment mechanism” requires EU companies to pay levies on certain imports based on the GHG emissions released during the manufacturing of those products.
Context: India is the world’s second-largest steel producer, and upwards of 60% of its steel exports go to the EU. Coal dominates the steel-making process in most of the world, making traditional steel production extremely carbon-intensive. Alternate methods exist that can reduce the carbon-intensity of steel production, including electric arc furnaces and direct reduced iron, if they’re powered by lower carbon energy resources.
India is facing increasing competition from China for the EU market and will need to adapt in order to not lose market share. China has already scheduled its first shipment of “green steel” (lower carbon) to Italy.
Fun Fact
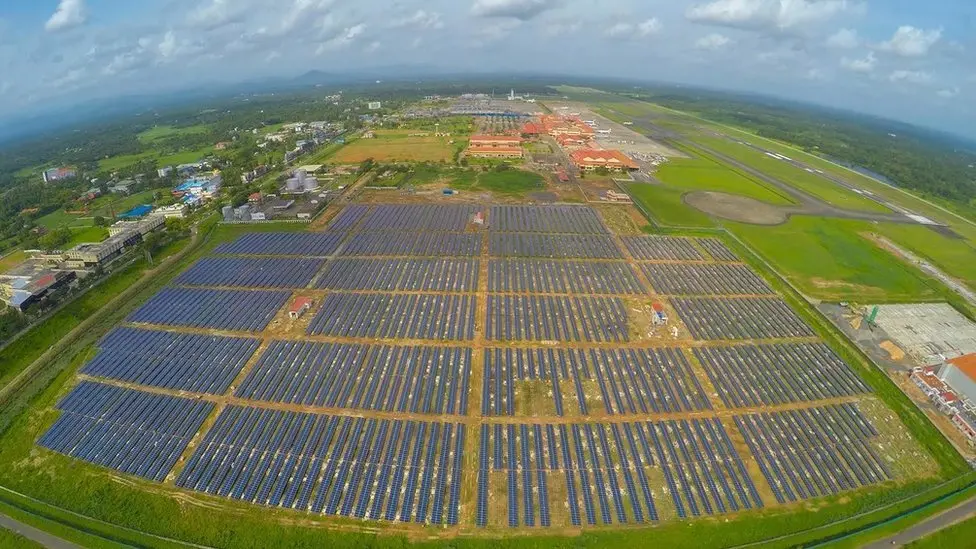
India is home to the world’s first solar-powered airport!
Cochin International Airport in Kerala, India, reached this milestone in 2015, generating more solar electricity than it takes to operate the airport (not including the airplanes themselves) and avoiding significant carbon emissions. The airport uses over 46,000 solar panels spread across 45 acres. Although the solar PV generates more total electricity than the airport uses, the airport relies on the grid to meet demand when the sun isn’t shining, and supplies surplus power back to the grid when solar production exceeds demand. Many airports across the world now use solar energy, but few are generating more electricity than they use.
Want to test your knowledge about energy in India? Take our quiz!
Guest contributors: Bharti Singhla, Momentum Capital
Understand Energy team contributors: Dr. Diana Gragg, Sharon Poore, Bria Schraeder, Racheal Moore, and Shirley Chang
The data in this issue are current as of January 2026.
Test Your Knowledge

Sources list:
India key metrics
- Population (October 2025): International Monetary Fund. India datasets: Population.
- GDP PPP & GDP PPP per capita (2025): International Monetary Fund. India datasets: GDP PPP, GDP PPP per capita.
- Annual energy consumption (2023): International Energy Agency (IEA). Countries & Regions: World Energy MIx, India Energy Mix.
- Net energy importer (2023): International Energy Agency (IEA). Countries & Regions: India Energy Mix.
- Top energy resource & top electricity resource (2023): International Energy Agency (IEA). Countries & Regions: India Energy Mix.
- Renewables share of electricity (2022): International Energy Agency (IEA). Countries & Regions: India Renewables.
- Annual electricity consumption & electricity consumption per capita (2023): International Energy Agency (IEA). Countries & Regions: India Electricity.
- Annual GHG emissions, GHG emissions sources, & annual per capita GHG emissions (2022): Climate Watch: Historical GHG Emissions; Worldometer. CO2 Emissions per capita.
India’s global rankings by resource
- Coal consumption (2023): International Energy Agency (IEA). Countries & Regions: World Coal.
- Oil consumption (2023): International Energy Agency (IEA). Countries & Regions: World Oil.
- Natural gas consumption (2023): International Energy Agency (IEA). Countries & Regions: World Natural gas.
- Hydro electricity generation (2024): Ember. Yearly Electricity Data.
- Nuclear electricity generation (2024): Ember. Yearly Electricity Data.
- Solar electricity generation (2024): Ember. Yearly Electricity Data.
- Wind electricity generation (2024): Ember. Yearly Electricity Data.
The History of India’s Energy
- Economic history: World Economic Forum with Visual Capitalist. Over 2000 years of economic history, in one chart. September 15, 2017.
- Hydropower history: National Institutes of Health (NIH). National Library of Medicine. Hydropower: A low-hanging sour-sweet energy option for India. 2023.
- Oil and gas history: The Hoover Institution. Survey of India. Evolution of India’s Energy System Post-Independence. 2025; Ministry of Petroleum & Natural Gas, Government of India. Indian Oil and Gas Industry.
- Nuclear history: The Hoover Institution. Survey of India. Evolution of India’s Energy System Post-Independence. 2025; World Nuclear Association. Nuclear Power in India.


