
Understand Energy in New Mexico

Happy August! This month’s issue of Stanford University’s Understand Energy Learning Hub Energy Spotlight covers energy in New Mexico, a state with vast energy resources and one of the top three energy-producing states in the United States. If you like what you see, please share widely and encourage others to subscribe. You can also check out all of our past issues!
If you’d like to learn more about energy in your own state, the U.S. Energy Information Administration (EIA) has state energy profiles.
What you need to know
Significance: New Mexico is the third largest energy-producing state in the U.S. behind Texas and Pennsylvania. It’s the nation’s second largest producer of crude oil, fourth largest producer of natural gas, and a net energy exporter. The hydraulic fracturing and horizontal drilling revolution, which started in the mid-2000s, has driven rapid growth in the state’s oil and natural gas production, primarily concentrated in the Permian Basin.
At the same time, New Mexico’s renewable electricity generation has grown rapidly, taking advantage of the state’s high quality wind and solar resources. In 2019, New Mexico enacted the Energy Transition Act, which has been key for increasing renewable energy in the state. Renewable resources supplied 50% of in-state electricity generation in 2024, meeting New Mexico’s 2030 clean electricity goal six years early.
New Mexico has a relatively small population for its size. Native Americans comprise about 12% of the population. Residential energy use per capita is low, ranking among the bottom five U.S. states. However, New Mexico’s total energy consumption per capita and per dollar of state GDP are both above the national average, primarily due to industry and transportation.
Top energy resource
Natural gas
(45% of total energy supply)
Key metrics for New Mexico
| Metric | U.S. state ranking | Associated data |
|---|---|---|
| Population | #36 | 2.1 million people (3% growth since 2010) |
| Real GDP | #38 | $119 billion |
| Annual total energy production | #3 | 8,523 trillion Btu |
| Annual energy consumption | #40 | 684.0 trillion Btu |
| Annual net in-state electricity generation | #37 | 40,008 GWh |
| Renewables share of net in-state electricity generation | #11 | 54% renewables |
| Clean electricity goals | - | 50% renewable by 2030 80% renewable by 2040 100% zero carbon resources by 2045* |
| Annual greenhouse gas (GHG) emissions | #34 | 77.250 MMT CO2e |
| Climate goal by 2030 | - | 45% fewer GHG emissions compared to 2005 levels |
| Climate goal by 2050 | - | Net zero GHG emissions |
*Zero-carbon resources standards for small rural electrical cooperatives are slated for 2050.
Energy production in New Mexico is dominated by crude oil and natural gas, primarily out of the Permian Basin which spans across New Mexico and Texas. The Permian Basin is the most prolific crude oil producing area in the U.S. Much of the crude oil and natural gas is exported out of state. New Mexico produces about 11 times the energy it consumes. New Mexico's oil and gas industry contributed almost half ($7.5 billion) of state general fund revenue in 2025.
New Mexico annual fossil fuel production
| Resource | U.S. state ranking | Amount produced |
|---|---|---|
| Crude oil | #2 | 2,244 thousand barrels/day |
| Natural gas | #4 | 3,599,780 million cubic feet |
| Coal | #14 | 7,199 thousand short tons |
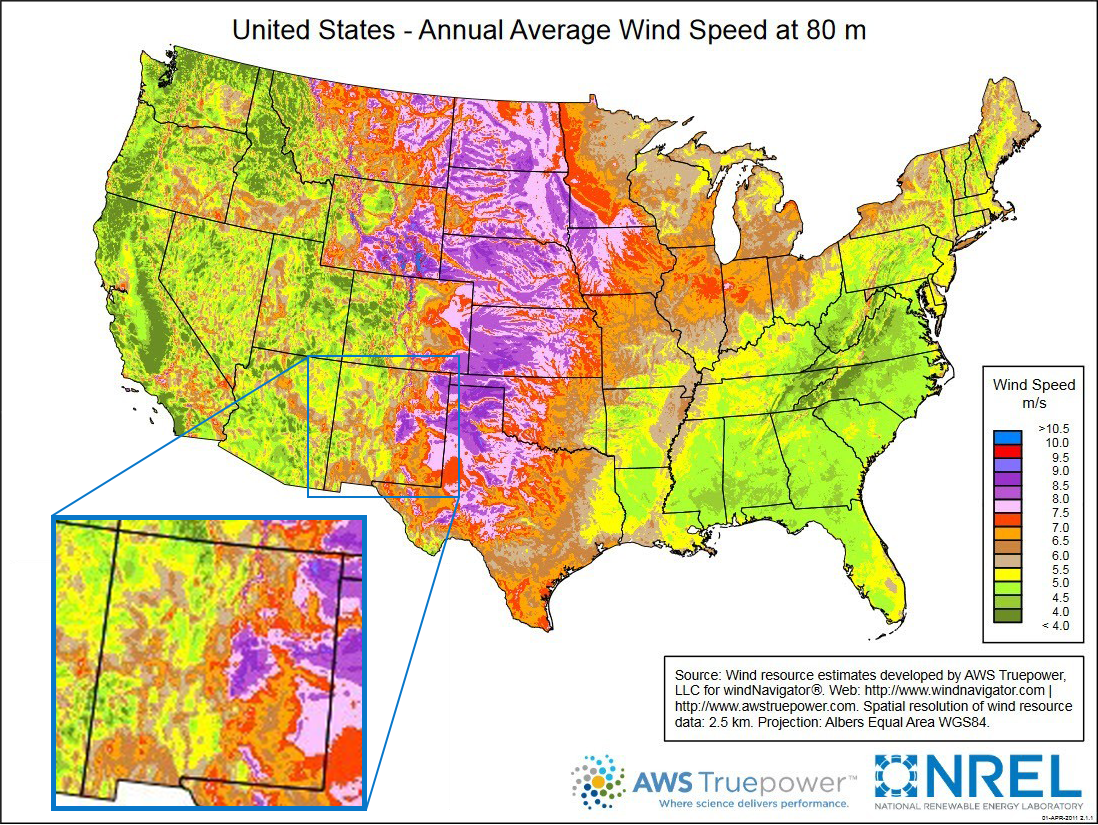
Electricity generation in New Mexico is now over 50% renewables, primarily wind and solar. New Mexico has some of the strongest wind and solar resources in the U.S.
New Mexico wind resource
New Mexico solar resource

Wind electricity generation in New Mexico had plateaued over the past few years, but the launch of the SunZia wind project in June has already increased the state’s 2026 wind electricity generation. The steep decline in coal’s share of New Mexico’s electricity generation (from 79% in 2006 to 20% in 2025) is largely due to coal’s inability to compete with cheaper natural gas, wind, and solar, and New Mexico’s 2019 Energy Transition Act requiring clean electricity. Coal’s decline in New Mexico mirrors what’s been happening with coal in the U.S. overall.
New Mexico also has 1,360 MW of operating utility-scale battery storage and plans for an additional 1,299 MW, the bulk of which is expected to come online by the end of 2027. Energy storage supports renewable energy integration and grid reliability.
New Mexico annual in-state electricity generation
| Resource | U.S. state ranking | Amount generated |
|---|---|---|
| Wind | #10 | 14,215 GWh |
| Natural Gas | #33 | 10,507 GWh |
| Coal | #29 | 8,182 GWh |
| Solar | #14 | 6,944 GWh |
New Mexico has significant potential geothermal resources and is increasingly focusing on expanding geothermal energy for electricity generation. The state currently has just one operating geothermal power plant (15 MW). This traditional geothermal power plant, which had been in decline, was recently restored to full capacity through the use of AI geoscience tools and new geothermal resource development. Advanced geothermal power plants are also planned. For example, XGS Energy and Meta have agreed to develop 150 MW of geothermal energy in the state using XGS's closed-loop technology.
With New Mexico’s history of nuclear research at Sandia and Los Alamos National Labs, the state is also attracting interest for fusion energy development. For example, Pacific Fusion selected Albuquerque for its $1B fusion energy research facility.
Energy consumption in New Mexico ranks near the bottom (40th) relative to other U.S. states, despite New Mexico being one of the country’s leading energy producers. States import and export energy resources and electricity, so the energy and electricity mix consumed in a state is different from the state’s energy production and electricity generation.
The top two primary energy resources used in New Mexico are natural gas and oil. Natural gas is used for heat in industry and buildings, and in electricity generation. Oil is used mainly for transportation.
New Mexico’s industrial sector includes energy-intensive oil and natural gas production and is the largest energy-consuming sector in the state, accounting for just under 40% of the state’s total energy consumption.
The transportation sector is next largest and consumes another third of the state’s energy. Energy use per capita in New Mexico’s transportation sector ranks among the top ten U.S. states. The low population density of New Mexico (it’s the sixth-least densely populated state) is a significant contributing factor as residents often must drive long distances between towns, services, and workplaces.
One way to improve transportation energy use per capita is to increase electrification of the vehicle fleet. Electric vehicles (EVs), which include both battery electric vehicles (BEVs) and plug-in hybrid electric vehicles (PHEVs), improve efficiency and reduce air pollution and greenhouse gas (GHG) emissions from transportation systems. BEVs are 3 to 4 times more efficient than their gasoline-fueled counterparts and cost 40-60% less to fuel. EVs are currently only 1% of the light-duty (personal) vehicle stock in New Mexico.
As EV penetration increases in New Mexico, additional charging infrastructure will be needed. New Mexico has several different programs to support future EV infrastructure growth, including its part of the federal Bipartisan Infrastructure Law, utility-sponsored EV charger rebates, and building codes.
EV charging stations in New Mexico

The residential and commercial sectors include energy used in buildings for heat, lighting, water heating, and appliances. They are the two smallest energy-consuming sectors in New Mexico but together make up 30% of New Mexico’s energy consumption. Energy efficiency (e.g., weatherization, LEDs, and natural lighting) and electrification can help reduce energy use in buildings while lowering costs, reducing air pollution and GHG emissions, improving human health and safety (e.g., helping people survive extreme heat), and enhancing services. For example, heat pumps are 3-4 times more efficient than natural gas furnaces and can provide both heating and cooling services. Currently, New Mexico’s share of home heating provided by natural gas (63%) is higher than the U.S. average (47%).
New Mexico is one of 13 U.S. states with a Clean Energy Standard. In January 2024, New Mexico adopted the 2021 International Energy Conservation Code (IECC), requiring builders to design and construct more efficient buildings. The state also offers an Energy$mart Weatherization program and several Energy Conservation and Management programs and incentives for increasing existing building efficiency, including this one for heat pumps, as well as other home electrification and appliance rebates and sustainable building tax credits programs.
New Mexico has one of the three lowest average electricity revenues per kWh (used as a proxy for price per kWh) in the U.S. The price for electricity is not just for electricity generation. New Mexico’s price for electricity also includes paying for transmission and distribution infrastructure, energy efficiency programs, grid modernization, and other electricity-related programs.
Average price of electricity to customers by end-use sector, May 2026
| New Mexico (cents per kilowatt-hour) | U.S. (cents per kilowatt-hour) | |
|---|---|---|
| Residential | 14.12 | 18.44 |
| Commercial | 10.18 | 13.54 |
| Industrial | 4.45 | 8.71 |
New Mexico’s electricity use per capita is increasing, likely due to electrification of end uses and new demand such as data centers.
Transitioning end use services to electricity provides many benefits including energy security (e.g., the sun and wind are free domestic fuels!), resource diversification (many resources can be used to generate electricity), and fewer environmental, climate, and human health impacts (e.g., the carbon-intensity of the grid decreases as more renewables are brought online). New Mexico has made notable progress in decarbonizing its electricity grid. Learn more in this article from Yale Climate Connections.
Environmental Impacts
Climate: Industry is the biggest GHG-emitting sector in New Mexico. The power industry sector has experienced the steepest decline with the addition of solar and wind energy, but is still contributing more GHG emissions than transportation.
Methane regulations: New Mexico’s 2021 Methane Waste Rule requires 98% natural gas capture and bans routine flaring by December 31, 2026. As a result, oil and natural gas produced on New Mexico's side of the Permian Basin has a methane-intensity (the amount of methane leaked per natural gas produced and sold) of 1.2%, which is significantly lower than the Texas side (3.1%). Because methane is a potent GHG, 1.2% is still too high. Methane intensity needs to be brought down to 0.2% to align with oil and natural gas industry commitments. See more methane data from New Mexico.
New Mexico’s Uranium Mining History
Uranium is the fuel used for nuclear power plants. The steps for producing low-enriched uranium (LEU) are shown below.

Prior to the 1990s, much of the uranium used in the U.S. was mined and milled domestically.
U.S. uranium supply to commercial nuclear reactors, 1950-2023

New Mexico was the epicenter of the U.S. uranium industry from the 1950s through the early 1980s. At its peak, hundreds of mines operated across the state, including the Jackpile-Paguate mine, the largest open-pit uranium mine in the world. From 1948 to 2002, the Grants Mining District in New Mexico produced over 30% of all domestic uranium. The last uranium mill within New Mexico shut down in 1990.
Legacy and cleanup: The many decades of uranium mining in New Mexico heavily impacted tribal lands and Native Americans. Many miners, most of whom were Native Americans, suffered extreme radiation exposure. Today, over 500 of the estimated 1,100 abandoned uranium mines in New Mexico remain on or close to the Navajo Nation, continuing to contaminate homes and water sources. The federal government has developed a ten-year plan to clean up about half of those mines through 2029.
In the news
News: New Mexico has the best distributed energy resources (DER) interconnection policy in the U.S., according to a joint analysis by Vote Solar and the Interstate Renewable Energy Council (IREC). It was the only state to receive the highest possible grade. New Mexico was recognized for having incorporated many interconnection best practices, including a strong energy storage interconnection framework, IEEE’s technical standard for DER interconnections, and frequent public reporting on its interconnection queue.
Examples of Distributed Energy Resources (DERs)

Context: DERs are sources of electricity generation or consumption located at or near customer demand. DERs include rooftop solar PV, battery storage, and flexible loads like heat pumps and electric vehicles. Having good interconnection best practices makes it easier for residential, commercial, and industrial customers to install DERs and connect them to the grid.
DERs have many potential benefits including lower costs (e.g., avoiding transmission and distribution upgrades), increased reliability (e.g., not losing power during a blackout), revenue opportunities (e.g., energy arbitrage – buying electricity when it's cheap and selling it when it's expensive), and reducing air pollution and GHG emissions (e.g., using energy storage to increase use of clean renewables).
Fun Fact
New Mexico is home to the largest wind farm in the U.S.!
The SunZia Wind Project, built by Pattern Energy and composed of 916 wind turbines, came online in June 2026. Its capacity of 3.65 GW is more than three times larger than the next two largest wind farms in the U.S. and nearly doubles New Mexico’s wind generating capacity. Most of SunZia’s electricity is expected to be exported to Arizona and Southern California.

Guest contributors: Travis Kellerman, Meredith Dixon, Fayth Gillespie
Understand Energy team contributors: Dr. Diana Gragg, Luke McFaul, Sharon Poore, Bria Schraeder, and Shirley Chang
Sources list:
Key metrics
- Top Energy Resource (2024): U.S. Energy Information Administration (EIA). State Energy Data System (SEDS): 1960-2024. Consumption. Primary Energy Consumption by Source.
- Top Electricity Resource (2024): U.S. Energy Information Administration (EIA). Electricity Data Browser. Net Electricity Generation.
- Population (July 2025): United States Census Bureau. Quick Facts New Mexico.
- Population ranking (2024): U.S. Energy Information Administration (EIA). U.S. States Table N1. Population, GDP, and Degree Days, Ranked by State, 2024.
- Real GDP and ranking (2024): U.S. Energy Information Administration (EIA). U.S. States Table N1. Population, GDP, and Degree Days, Ranked by State, 2024.
- Annual total energy production and ranking (2024): U.S. Energy Information Administration (EIA). U.S. States New Mexico Rankings.
- Annual energy consumption and ranking (2024): U.S. Energy Information Administration (EIA). U.S. States Table C10. Total energy consumption estimates, real gross domestic product (GDP), energy consumption estimates per real dollar of GDP, ranked by state, 2024
- Annual net in-state electricity generation and ranking (2025): U.S. Energy Information Administration (EIA). Electricity Data Browser. Annual Net Generation for All Sectors by State. Accessed August 11, 2026.
- Renewables share of net in-state electricity generation and ranking (2025): U.S. Energy Information Administration (EIA). Electricity Data Browser. Annual Net Generation for All Sectors by State. Accessed August 6, 2026.
- Clean electricity goals: Office of the Governor Michelle Lujan Grisham. Press release: Governor signs landmark energy legislation, establishing New Mexico as a national leader in renewable transition efforts. March 22, 2019.
- Annual greenhouse gas emissions and ranking (2022): U.S. Environmental Protection Agency (EPA). Greenhouse Gas Inventory Data Explorer. Accessed August 2026.
- Climate goals by 2030 and 2050: New Mexico Climate Action Plan.
Annual fossil fuel production
- Crude oil production and ranking (2025): EIA. Petroleum and Other Liquids. Crude Oil Production.
- Natural gas production and ranking (2024): EIA. Natural Gas Gross Withdrawals and Production (Marketed Production).
- Coal production and ranking (2024): EIA. Coal Data Browser. Accessed August 11, 2026.
Annual in-state electricity generation
- Wind, natural gas, coal, and solar in-state electricity generation and rankings (2025): EIA. Electricity Data Browser. Annual Net Generation for All Sectors by State. Accessed August 12, 2026.


