Understand the Water-Energy Nexus

Happy May! In last month's edition of Stanford University’s Understand Energy Learning Hub Energy Spotlight, we covered hydropower, using the power of flowing water to generate electricity. This month, we continue our water and energy theme by exploring the interconnected relationship between our water and energy systems. If you like what you see, please share widely and encourage others to subscribe. You can also check out all of our past issues!
What you need to know
Significance: Our energy and water systems are foundational to human well-being and economic development. They can also negatively impact the environment, climate, and human health. Both systems face challenges from population and demand growth, climate change, and lack of access. Energy is critical for our water systems, and water is critical for our energy systems.
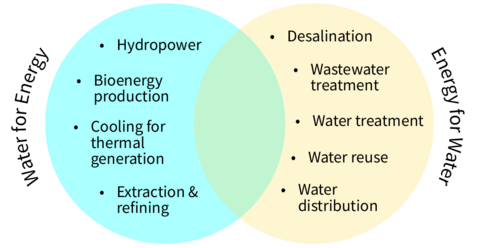
What is the water-energy nexus? The interdependent relationship between our water and energy systems is referred to as the water-energy nexus. On the energy side, water is used for energy resource extraction and processing, energy conversion (e.g., hydropower), cooling, irrigation (e.g., biofuels), and waste management. On the water side, energy is used for water extraction, treatment, reuse (aka recycling), conditioning (e.g., heating and cooling), and delivery to residential, commercial, and industrial consumers.
Water-energy nexus
Let’s start with some key terms to describe water use and availability.
Water use and impacts fall into three main categories:
- Withdrawal refers to the amount of water taken out of the environment, even if it is eventually returned to the same body of water. In some cases, withdrawn water is used for cooling and is returned to its source ~15–22°F warmer, resulting in thermal pollution. Withdrawals can be freshwater or saltwater.
- Consumption is the amount of water that is withdrawn but not returned to its original source (e.g., ocean, lake, river). Consumption is included as part of withdrawals and is typically freshwater. Consumption includes things like evaporation from cooling towers and irrigation systems, water consumed by humans or animals, and production of green hydrogen.
- Contamination occurs when pollutants (e.g., toxins, pathogens) that are harmful to people, animals, or the environment are discharged into water bodies without adequate treatment. As one example from the energy system, toxic pollutants like lead, mercury, and sulfur oxides (SOx) released into the air from coal-fired power plants can settle into bodies of water.
Water availability is assessed by three main factors:
- Quantity is the total amount of water available.
- Quality refers to chemical, physical, and biological characteristics of water. Some examples of water quality impacts are temperature changes, oxygen levels, nutrient levels, salinity, and pollutant concentrations.
- Adequacy is the ability to provide clean, safe, affordable water to meet the specific needs of a population or system.
Water quantity and quality determine the suitability of water for end uses, such as drinking water or agriculture. Adequacy establishes who has access to the quantity and quality of water they need.
Note that definitions for water use and consumption vary across different organizations and standards. In addition, energy-related water withdrawals and consumption aren’t tracked comprehensively on a global or country by country basis, and much of the data that is available is old or inconsistent. The same is true for energy use in our water systems. We do our best to accurately represent the water-energy nexus with the data available.
Water use in energy systems
Water withdrawals: Energy systems account for roughly 10% of the world’s freshwater withdrawals. In the United States, energy systems are responsible for about 40% of freshwater withdrawals. Energy systems also account for 40% of the U.S.’s total water withdrawals (freshwater and saltwater combined), most of which is freshwater. Non-consumptive water used for hydropower, often referred to as “pass through,” is not included in this data because it is classified as “in-stream use” (i.e., it is not removed from the source).
Irrigation accounts for the largest share (46%) of U.S. total water withdrawals. A small portion of irrigation is for energy crops (e.g., corn and soy for biofuels) and is part of the energy system. Thermal power plant cooling, another part of the energy system, has the next largest share (33%). A significant portion of the water withdrawn for thermal power plant cooling is not freshwater. Saltwater accounts for 35% of water withdrawals for thermal power plant cooling.
Water consumption: U.S. energy systems account for about 10% of U.S. total water consumption. Irrigation is the U.S.’s largest consumptive use of water (81% of U.S. total water consumption). Thermal power plant cooling, on the other hand, accounts for less than 3% of U.S. total water consumption because almost all of the water used is returned to its source.
Water consumption for the U.S. energy system, 2014
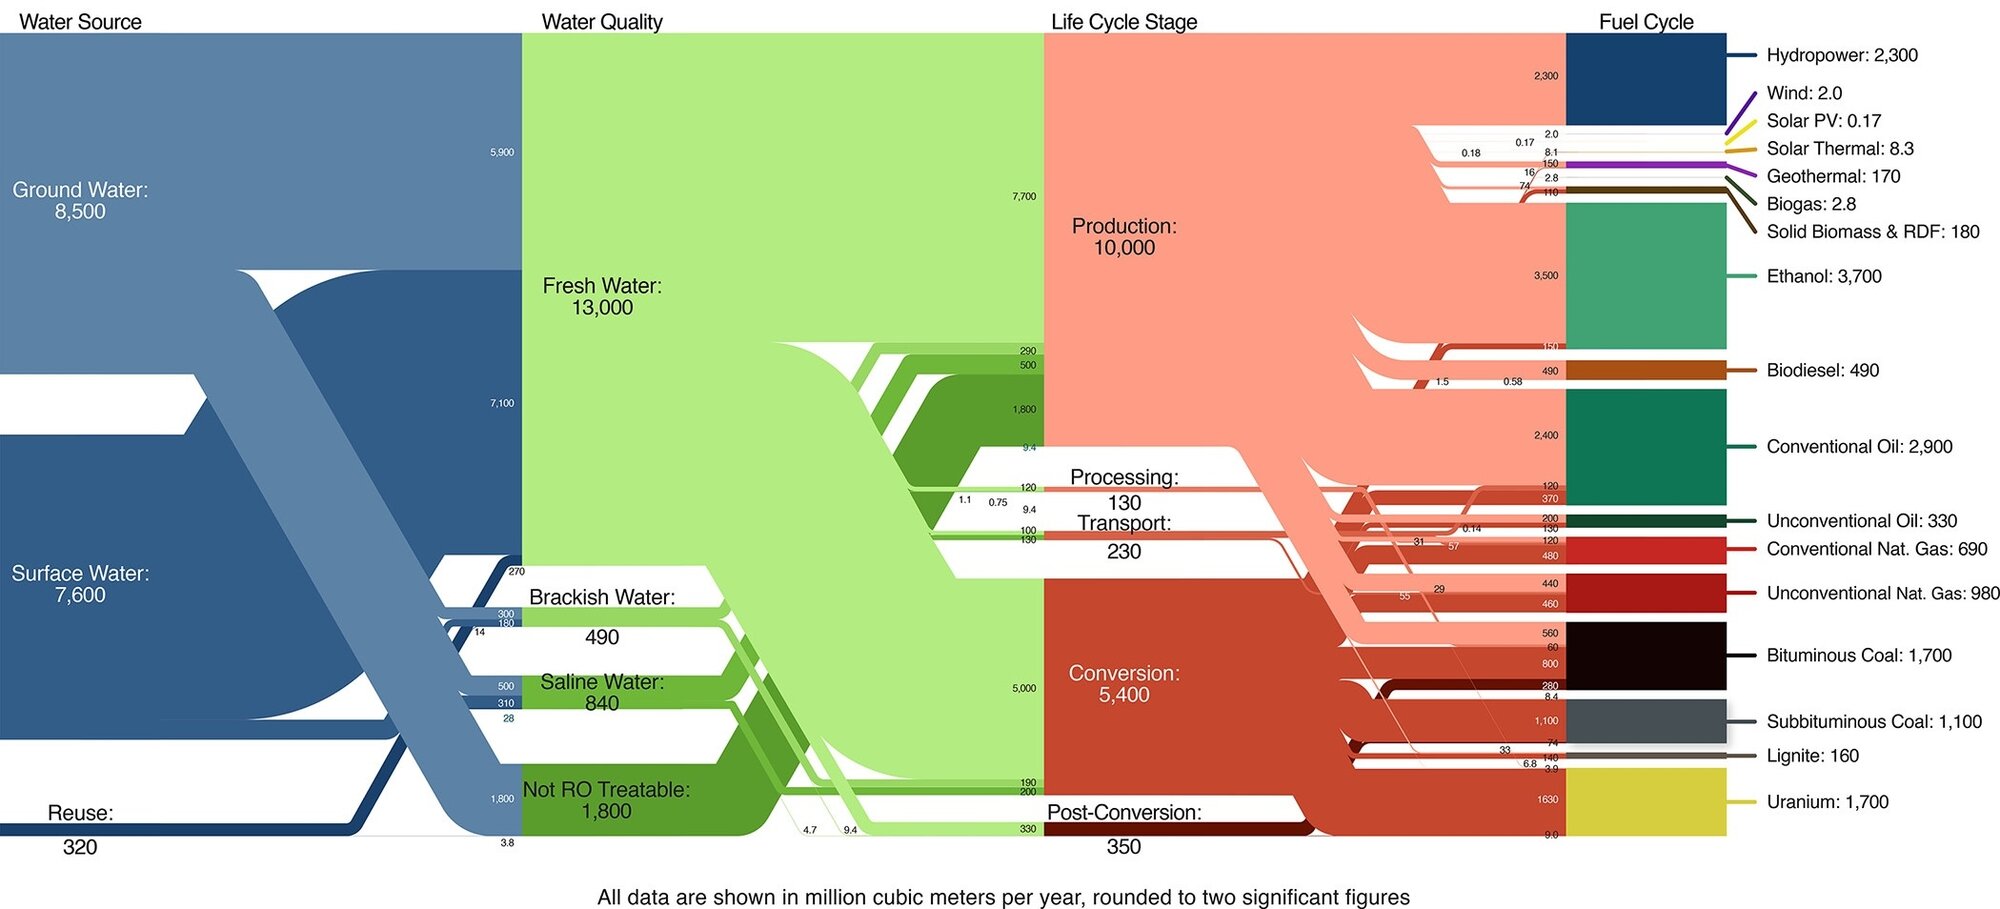
Another way to look at water consumption in energy systems is by energy resource, as shown in the figure above. Ethanol (e.g., irrigation for corn), oil (e.g., deep well injection, usually of non-freshwater), coal (e.g., power plant cooling), and hydropower (e.g., evaporation) are the biggest consumptive water uses in U.S. energy systems; wind and solar photovoltaics (PV) are the smallest.
Water intensity: All energy resources use water, but they have different levels of water intensity (water withdrawal or consumption per unit of energy delivered to the consumer). For example, oil production is a major water consumer in the U.S. energy system because the U.S. produces such large volumes (#1 producer of oil in the world), but its consumptive water intensity (water consumed per energy delivered) is extremely low. Biofuels like ethanol and biodiesel, on the other hand, are far more water intensive (in consumption and withdrawal) than oil.
The water intensity of energy resources in the U.S. varies significantly. Wind and solar PV, the cheapest and cleanest U.S. energy resources, require almost no water. Nuclear (uranium) and coal are orders of magnitude more water withdrawal intensive than any other energy resource, largely because of thermal power plant cooling, but have low consumptive water intensity. Geothermal, hydropower, biofuels, and solar thermal electricity fall in between for water withdrawal intensity and higher than other energy resources for consumptive water intensity.
How thermal power plant cooling systems work
Thermal power plants (e.g., coal, nuclear, and natural gas power plants) are heat engines that typically use water for cooling. The three main thermal power plant cooling methods are described below.
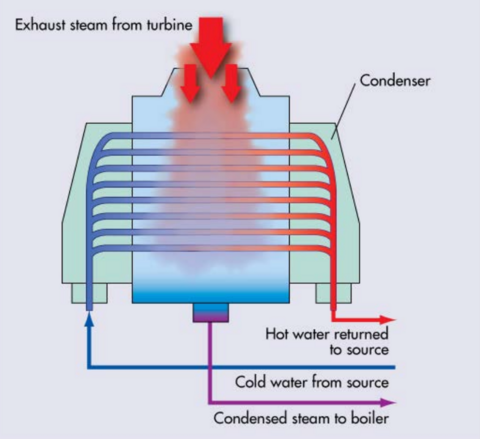
Once-through cooling systems withdraw water from sources like oceans, lakes, and rivers to provide the cooling service, and then discharge the water back to its original source at higher temperatures (typically 15-22°F warmer). These systems have high water withdrawals and low water consumption but cause thermal pollution. Thermal pollution and the water intake process can both harm fish and other aquatic organisms. In the U.S., 24% of power plant cooling systems are once-through cooling.
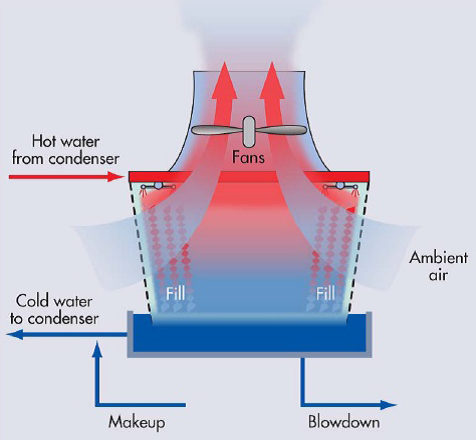
Closed-loop cooling systems circulate water through cooling towers where the water is cooled via evaporation. Closed-loop cooling systems have much lower water withdrawals than once-through cooling but higher water consumption as more water is lost to evaporation. Because of the lower water withdrawals and no thermal pollution, these systems also can have lower aquatic impacts than once-through cooling. Closed-loop systems are the most commonly used cooling method in the U.S., accounting for 66% of power plant cooling systems.
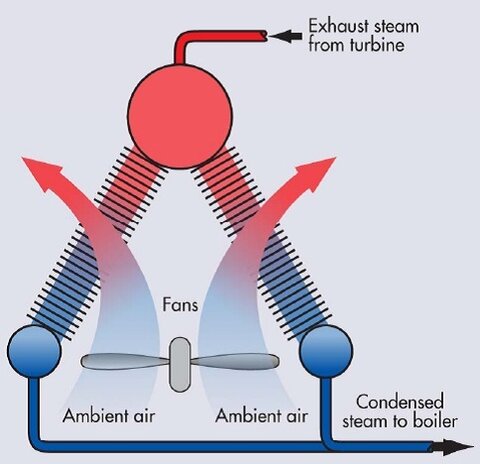
Dry cooling systems use fans to blow ambient air and provide cooling (like a car radiator). Dry cooling systems are far less efficient than water cooling systems but are used in regions where water is scarce or expensive (e.g., deserts). In the U.S., 8% of power plant cooling systems use dry cooling.
Energy use in water systems
Three percent of global electricity generation is used by water systems. In the U.S., water systems use 13% of electricity generation. These statistics and the chart below do not include non-electricity energy use by the water sector such as using natural gas for water heating, a significant energy use in water systems. For example, water heating is the second largest use of energy in U.S. residential homes, much of which is supplied by natural gas.
Moving water around via pumping (included in the supply, distribution, and transfer categories above) is a particularly big use of electricity in water systems. For example, pumps can move freshwater from rivers to agricultural land for irrigation or potable water to residential, commercial, and industrial consumers. Other electricity-intensive aspects of water systems include treatment to make water potable (included in the supply category) and wastewater treatment.
Social and environmental impacts
Water has many competing uses (e.g., drinking, sanitation, power plant cooling, irrigation, ecosystems, fishing industry, recreation), making water adequacy a challenge around the world. Freshwater is often the focus because it’s important for agriculture and drinking water. Water use issues are highly localized based on the water availability and needs of a particular region.
Our current energy practices significantly impact water availability and quality. For example, corn-based ethanol (a biofuel) uses 40% of U.S. corn crops to provide ~10% of U.S. gasoline (E10). Corn is a water- and fertilizer-intensive crop. This increase in corn acreage for ethanol stresses the water supply and increases fertilizer loading in natural waterways, which negatively impacts ecosystems. Fertilizer nutrients that pollute the Mississippi River flow into the Gulf of Mexico where they stimulate massive algal growth. When algae die and decompose, they deplete the water of oxygen and create a “dead zone,” killing fish and other aquatic life in the area. Numerous additional examples of energy’s impacts on water exist, including coal ash, oil sands, and thermal pollution from once-through cooling.
Gulf of Mexico dead zone

Climate change is making our water warmer, which impacts the efficiency and operability of thermal power plants. Climate change is also causing more frequent and more severe droughts that affect water availability for our energy systems.
Current and future trends
Clean energy transitions can positively impact our global water systems. For example, as the U.S. shifts away from coal and nuclear to more wind, solar PV, and natural gas, the water intensity of the U.S. electricity system is declining. Another example is the electrification of domestic hot water heaters, which improves energy efficiency, reducing energy use in water systems (and saving money!).
Desalination is small but growing. As freshwater becomes scarce, more regions are turning to desalination, an expensive and energy-intensive way to meet their growing water demands. About 40% of the global desalination installed capacity is located in the Middle East and North Africa.
In the news
News: In many rural Nigerian communities, most irrigation systems are powered by fossil fuels. A 2026 study published in Frontiers in Sustainable Food Systems demonstrated that a solar-powered water pumping system was able to reliably and economically produce the energy needed for agricultural irrigation, providing a viable alternative to diesel pumps.
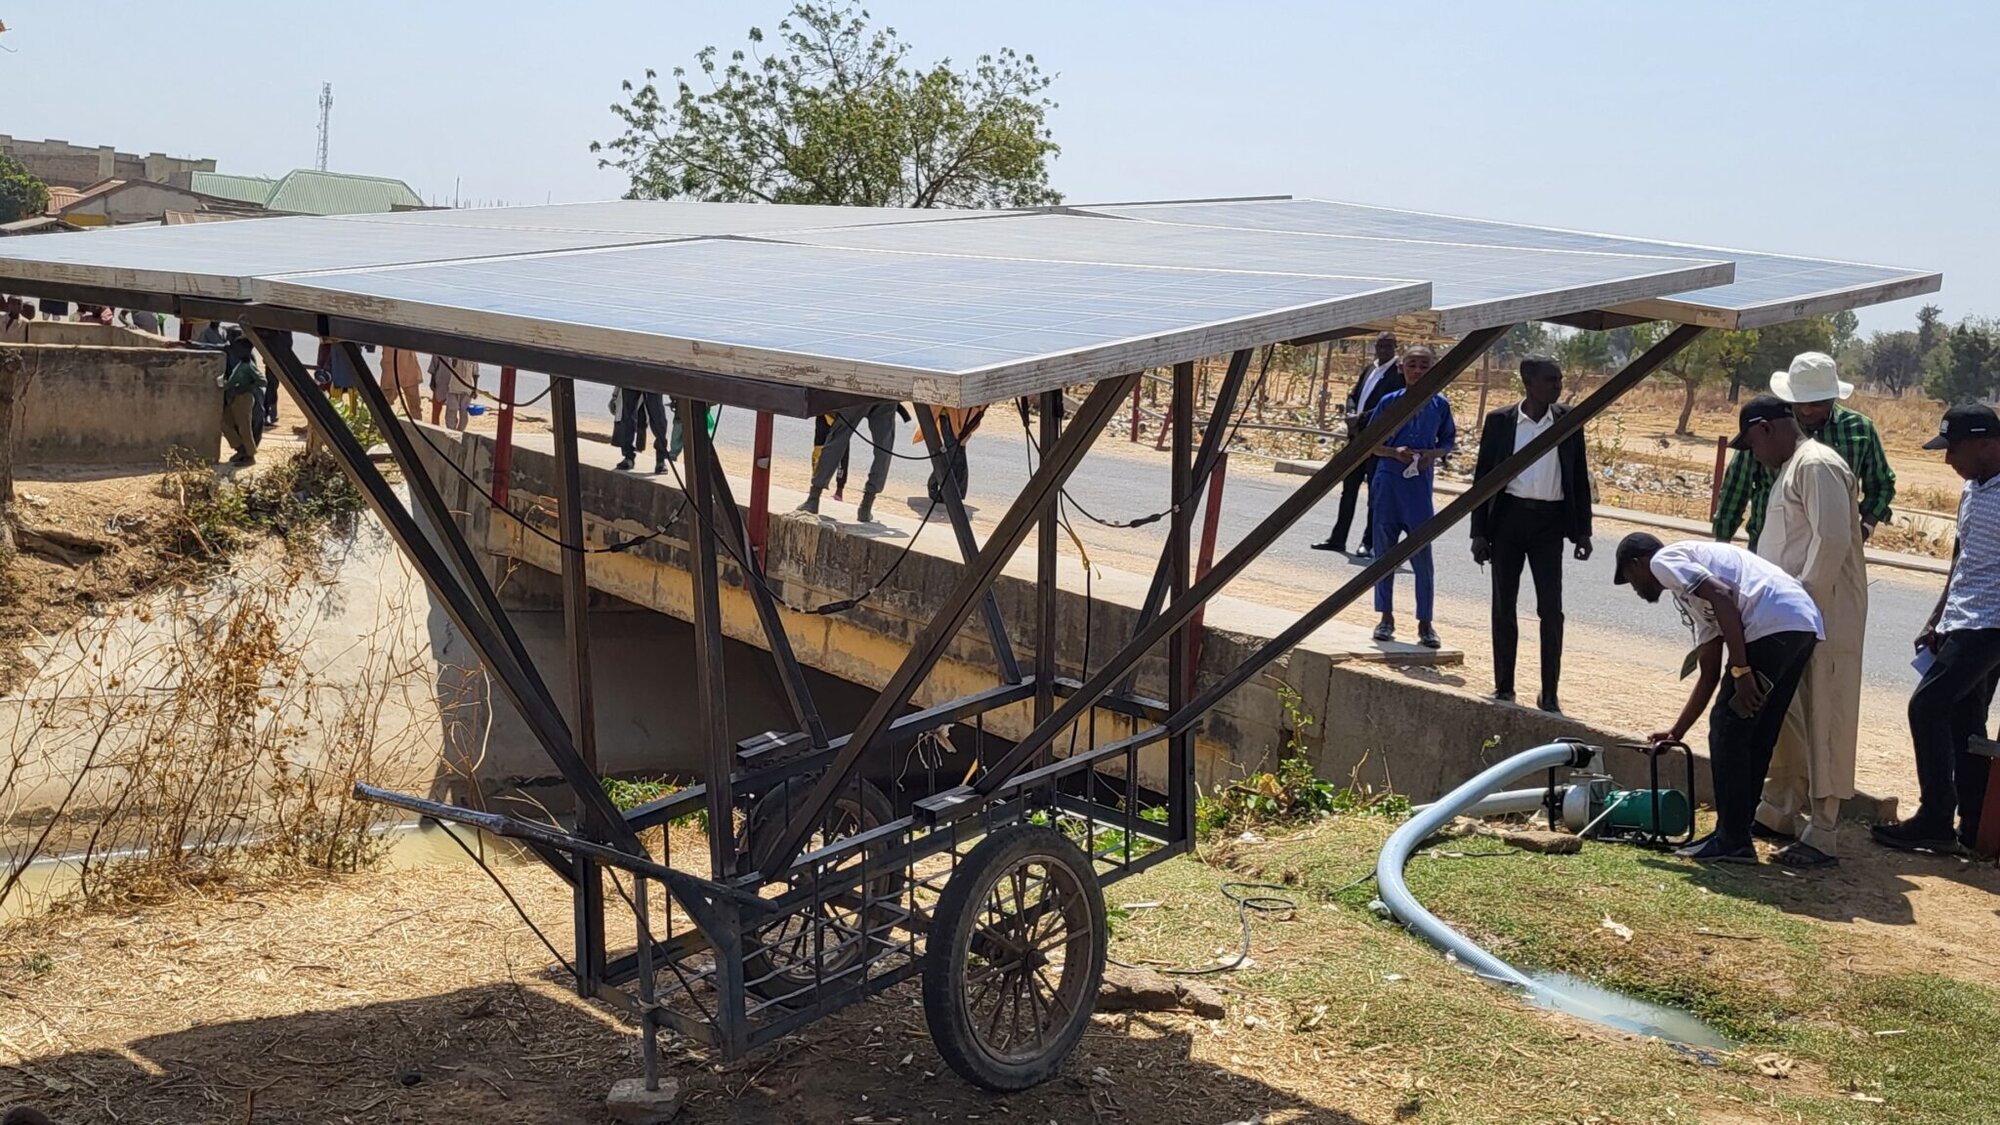
Context: Much of rural Nigeria experiences unpredictable rainfall cycles and prolonged dry seasons exacerbated by climate change, making irrigation crucial for year-round agricultural production. Year-round agriculture is critical for securing local food supplies and helping to keep rural economies thriving. Successful solar-powered irrigation projects in Nigeria have increased crop yields and improved year-round farming while also reducing operating costs by more than 60% and eliminating greenhouse gas emissions.
Solar irrigation systems are an example of using clean energy to supply water. Numerous studies around the world have concluded that while solar irrigation systems have a high initial cost relative to diesel systems, their low maintenance and operation costs make them more cost-effective in the long run. Several other countries are also looking at solar-powered irrigation as a way to reduce energy costs and improve crop yields, including Rwanda and Ethiopia. Innovative financing is necessary to scale these technologies and help farmers overcome the high up-front costs so they can reap the economic benefits.
Fun Fact
California’s largest single user of electricity is a water pumping plant.
The Edmonston Pumping Plant moves water over the Tehachapi Mountains into Southern California. It’s the highest single lift pumping plant in the world and is used to lift water 1,926 feet! The Edmonston Pumping Plant has 14 pumping units and a capacity of 835 MW. It consumes about 1% of all electricity used annually in California, making it the largest single source point of power demand in the state.

Guest contributors: Felicia Marcus, Stanford Woods Institute for the Environment and Meagan Mauter, Associate Professor, Civil & Environmental Engineering, Stanford University
Understand Energy team contributors: Dr. Diana Gragg, Racheal Moore, Sharon Poore, and Shirley Chang
The data in this issue are current as of May 2026.
Data sources for U.S. water withdrawal and consumption chart
USGS. Water budget results for a water availability assessment across the conterminous United States for water years 2010-2020. (2024); USGS. Thermoelectric-power water use reanalysis for the 2008-2020 period by power plant, month, and year for the conterminous United States. (2023); USGS. Public supply water use reanalysis for the 2000-2020 period by HUC12, month, and year for the conterminous United States (ver. 2.0, August 2024). (2024); USGS. Monthly crop irrigation withdrawals and efficiencies by HUC12 watershed for years 2000-2020 within the conterminous United States (ver. 2.0, September 2024). (2024); USGS. Estimated Use of Water in the United States in 2015. (2018); Argonne National Laboratory. Produced Water Volumes and Management Practices in the United States. (2009); Congressional Research Service. “The Energy-Water Nexus: The Energy Sector’s Water Use.” (2013); The River Network. The Carbon Footprint of Water. (May 2009)
Sources for water consumption for the U.S. energy system Sankey diagram
See Supporting Information for underlying data and more detail. ACS Publications. Water Use in the United States Energy System: A National Assessment and Unit Process Inventory of Water Consumption and Withdrawals. May 8, 2018.


